. 2011 Feb;23(2):550-66.
doi: 10.1105/tpc.110.075267. Epub 2011 Feb 18.

vanishing tassel2 encodes a grass-specific tryptophan aminotransferase required for vegetative and reproductive development in maize

Affiliations

vanishing tassel2 encodes a grass-specific tryptophan aminotransferase required for vegetative and reproductive development in maize

Kimberly A Phillips et al. Plant Cell. 2011 Feb.

Abstract

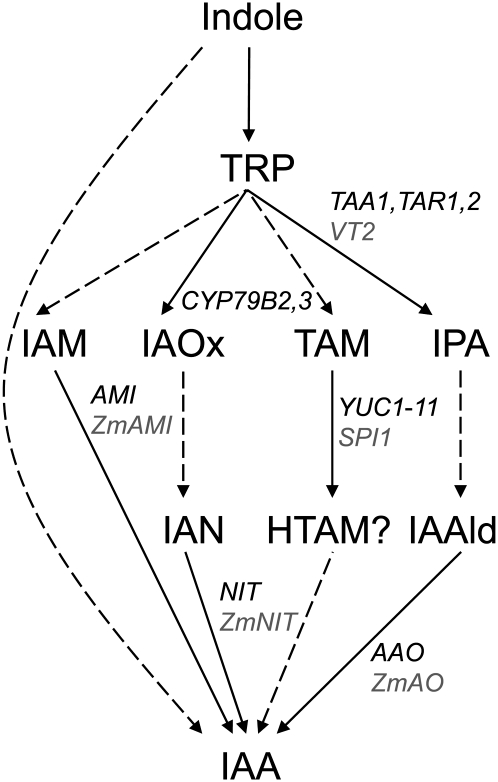
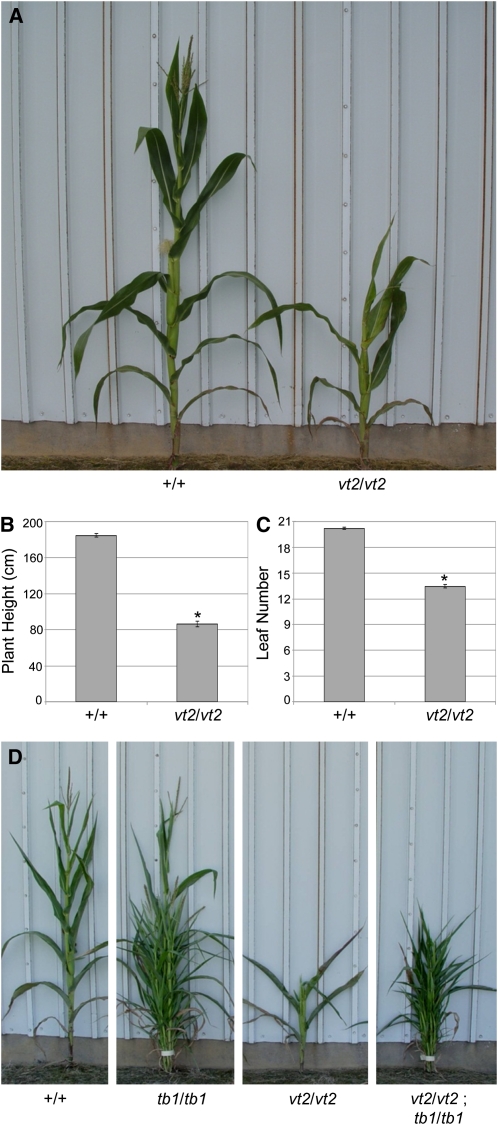
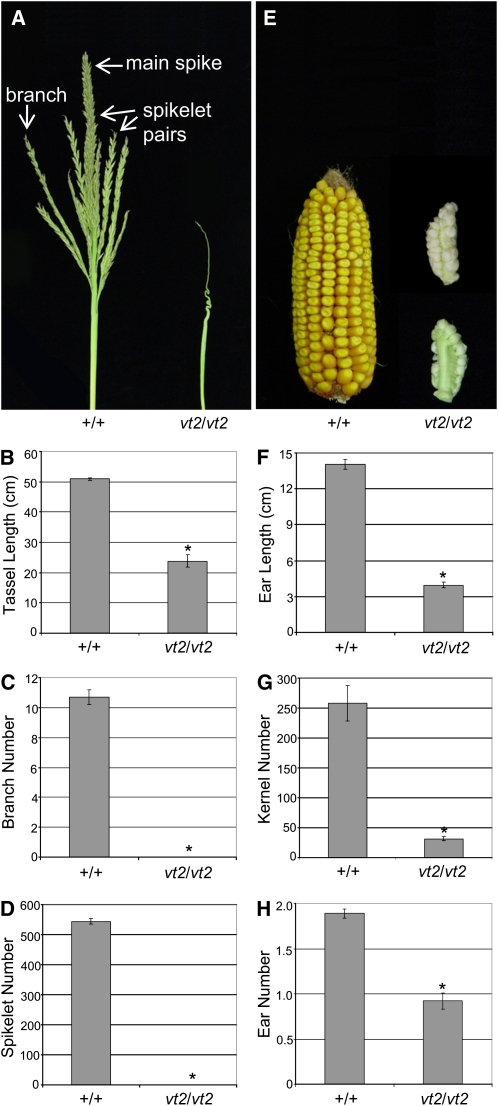
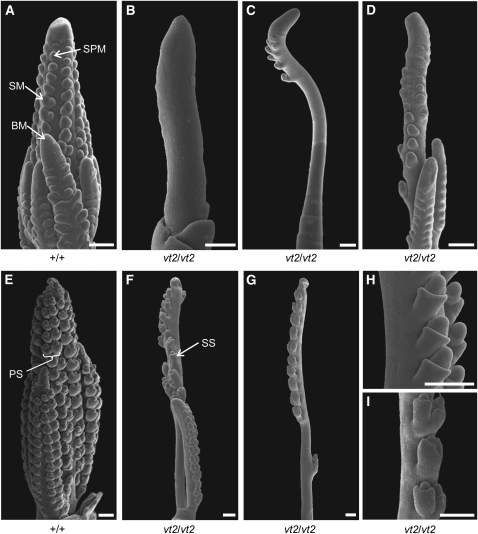
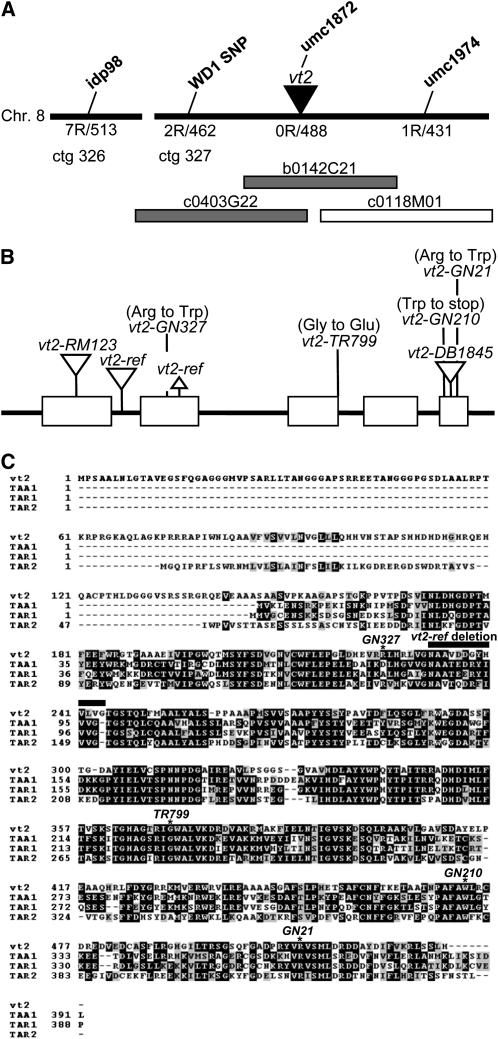
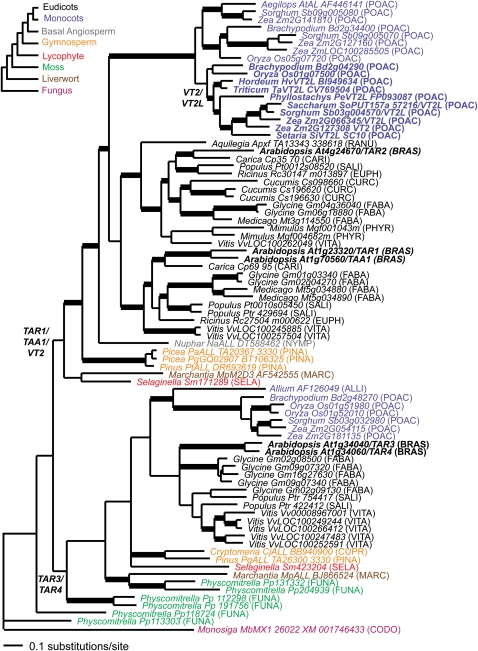
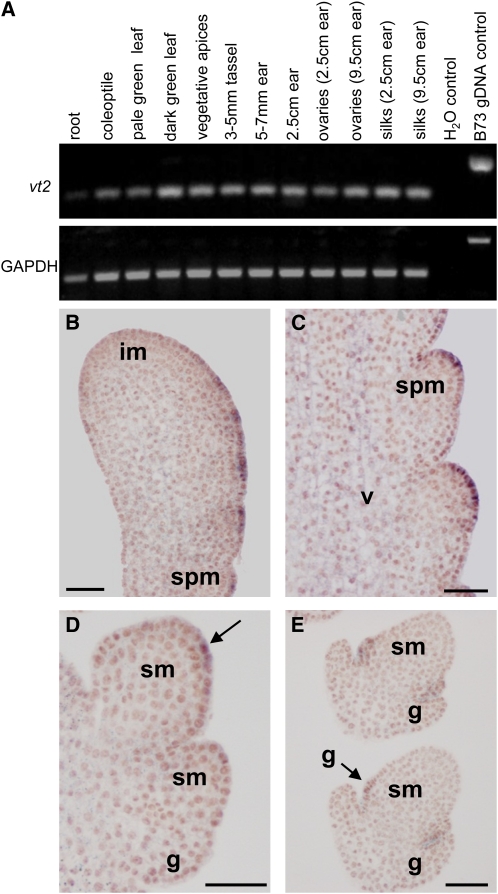
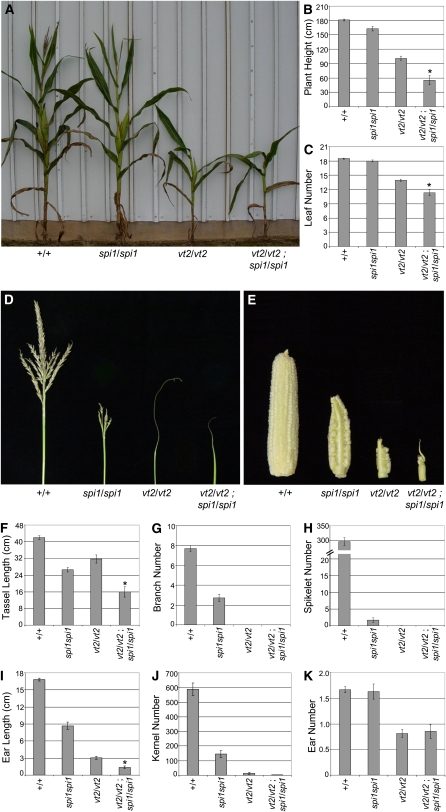
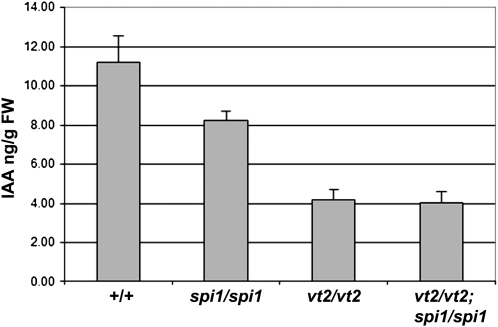
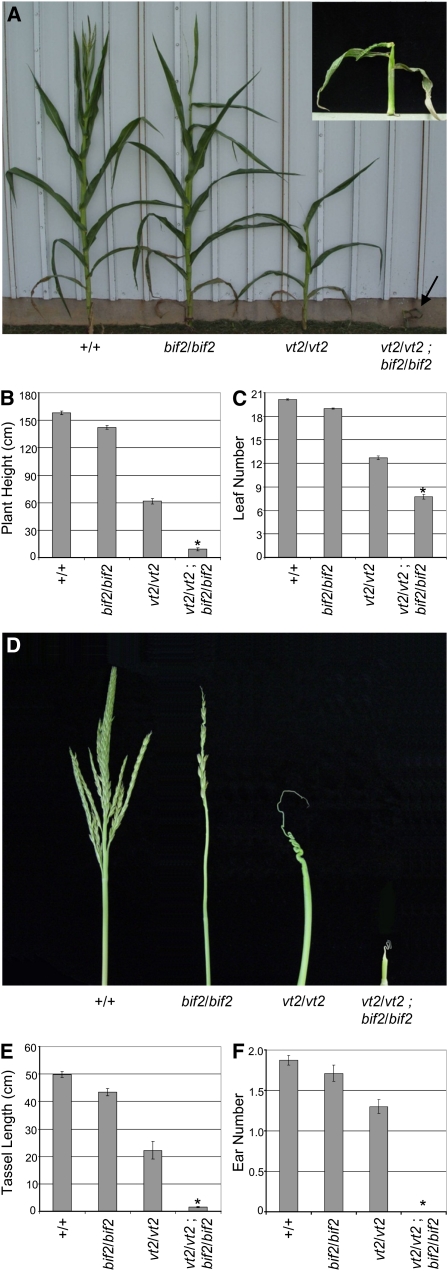
Auxin plays a fundamental role in organogenesis in plants. Multiple pathways for auxin biosynthesis have been proposed, but none of the predicted pathways are completely understood. Here, we report the positional cloning and characterization of the vanishing tassel2 (vt2) gene of maize (Zea mays). Phylogenetic analyses indicate that vt2 is a co-ortholog of TRYPTOPHAN AMINOTRANSFERASE OF ARABIDOPSIS1 (TAA1), which converts Trp to indole-3-pyruvic acid in one of four hypothesized Trp-dependent auxin biosynthesis pathways. Unlike single mutations in TAA1, which cause subtle morphological phenotypes in Arabidopsis thaliana, vt2 mutants have dramatic effects on vegetative and reproductive development. vt2 mutants share many similarities with sparse inflorescence1 (spi1) mutants in maize. spi1 is proposed to encode an enzyme in the tryptamine pathway for Trp-dependent auxin biosynthesis, although this biochemical activity has recently been questioned. Surprisingly, spi1 vt2 double mutants had only a slightly more severe phenotype than vt2 single mutants. Furthermore, both spi1 and vt2 single mutants exhibited a reduction in free auxin levels, but the spi1 vt2 double mutants did not have a further reduction compared with vt2 single mutants. Therefore, both spi1 and vt2 function in auxin biosynthesis in maize, possibly in the same pathway rather than independently as previously proposed.


Figures

Figure 1.
Figure 1.
Proposed Auxin Biosynthesis Pathways in Arabidopsis and Maize. One Trp-independent and four Trp-dependent pathways have been proposed. Dotted lines indicate steps that are inferred. Solid lines indicate steps for which genes encoding enzymes catalyzing the reaction have been identified from either Arabidopsis (black) or maize (gray). IAN, indole-3-acetonitrile; HTAM, N-hydroxyl tryptamine. Adapted from Bartel (1997), Woodward and Bartel (2005), Kriechbaumer et al. (2006), and Sugawara et al. (2009).
Figure 2.
Figure 2.
Mature Vegetative Phenotype Analysis of vt2 Mutants. (A) vt2 mutants are much shorter than their wild-type siblings. (B) Quantification of plant height. (C) Quantification of leaf number. (D) Mature vegetative phenotypes of individuals from a segregating vt2 tb1 double mutant family show that vt2/vt2 tb1/tb1 double mutants produce many tillers like tb1/tb1 single mutants. Asterisk indicates significant reduction from normal siblings at P < 0.05; error bars represent the se; n = 37 vt2 and 113 normal. [See online article for color version of this figure.]
Figure 3.
Figure 3.
Mature Inflorescence Phenotype Analysis of vt2 Mutants. (A) Wild-type tassels normally produce multiple lateral branches. The branches and the main spike are covered in pairs of spikelets. vt2 mutant tassels produce no lateral branches or functional spikelets. (B) Quantification of tassel length. (C) Quantification of tassel branch number. (D) Quantification of spikelet number in the tassel. (E) Wild-type ears normally produce hundreds of kernels in regular rows from the base to the tip, whereas vt2 mutant ears are smaller in size, produce very few kernels, and typically have barren patches on one or both sides of the ear (both sides of the same vt2 ear are shown on the right). (F) Quantification of ear length. (G) Quantification of kernel number. (H) Quantification of visible ear shoot number. Asterisk indicates significant reduction compared with normal siblings at P < 0.05; error bars represent the se; n = 10 vt2 and 10 normal. [See online article for color version of this figure.]
Figure 4.
Figure 4.
Scanning Electron Micrographs of Developing Inflorescences. (A) Wild-type field-grown tassel at 3-mm stage exhibiting BMs at the base and SPMs covering the branches and main spike. (B) vt2 field-grown tassel at 3-mm stage exhibiting complete lack of BM and SPM initiation. (C) vt2 field-grown tassel at 4- to 5-mm stage producing a few SPMs near the tip. (D) vt2 greenhouse-grown tassel at 4- to 5-mm stage displaying a weak mutant phenotype, with several BMs at the base and many SPM on the branches and main spike. (E) Wild-type greenhouse-grown tassel later in development at 6- to 7-mm stage exhibiting production of paired SMs in regular rows on all branches and the main spike. (F) vt2 greenhouse-grown tassel later in development at 6- to 7-mm stage showing production of paired SMs on the branches and paired or single SMs on the main spike. (G) vt2 mutant tassel at 6- to 7-mm stage grown at cooler greenhouse temperatures compared with typical greenhouse conditions for maize. Mutants grown in these conditions display intermediate phenotypes between field-grown and typical greenhouse-grown tassels, with no BMs and few SPMs, which give rise to paired or single SM. (H) Close-up of 4- to 5-mm vt2 tassel grown at cooler greenhouse temperatures, displaying two files of single SMs produced along the main spike. (I) Close-up of 6- to 7-mm vt2 tassel (from [G]) grown at cooler greenhouse temperatures, displaying both paired and single SMs along the main spike. PS, paired spikelet; SS, single spikelet. Bars = 250 μm.
Figure 5.
Figure 5.
Cloning and Sequence Analysis of vt2. (A) Diagram representing the vt2 region in maize after mapping with public and SNP markers (not to scale). The number of recombinant chromosomes (R) out of the total number of chromosomes is displayed below each marker. Maize BAC clones within this region are represented by rectangles, with the shaded rectangles indicating the overlapping clones on which vt2 was identified. (B) Schematic of the vt2 gene structure including the position and mutations of seven alleles. Exons are represented by boxes; insertions and deletions are represented by downward and upward triangles, respectively. (C) Sequence alignment of the predicted vt2 protein and three Arabidopsis Trp aminotransferases. vt2 shows the highest similarity to TAR2. Asterisks indicate the position of mutations in each EMS allele. Bar line indicates the position of the vt2-ref deletion.
Figure 6.
Figure 6.
Phylogenetic Analysis. Bayesian consensus phylogram of 82 vt2-like alliinases using the GTR model of evolution with some invariant sites and Γ distributed rates (GTR + I + Γ). Bold branches are supported by clade credibility ≥ 0.95. Color coding depicts different taxa. The cartoon depicts the accepted relationships among sampled taxa. Family abbreviations are included in parentheses (ALLI, Alliaceae; BRAS, Brassicaceae; CARI, Caricaceae; CODO, Codonosigidae; CUPR, Cupressaceae; CURC, Curcubitaceae; EUPH, Euphorbiaceae; FABA, Fabaceae; FUNA, Funariaceae; MARC, Marchantiaceae; NYMP, Nymphaeaceae; PHYR, Phyrmaceae; PINA, Pinaceae; POAC, Poaceae; RANU, Ranunculaceae; SALI, Salicaceae; SELA, Selaginaceae; SOLA, Solanaceae; and VITA, Vitaceae). The alignment used for this analysis is available as Supplemental Data Set 1 online.
Figure 7.
Figure 7.
vt2 Is Expressed in the Epidermis and Vasculature. (A) Qualitative RT-PCR shows that vt2 is expressed in all tissues tested. (B) to (E) RNA in situ hybridization on immature B73 tassels using pooled antisense probes from the 5′ and 3′ ends of vt2. im, inflorescence meristem; g, glume; v, vasculature; GAPDH, glyceraldehyde 3-phosphate dehydrogenase control. Bars = 50 μm. (B) Apical inflorescence meristem (from the top of a branch) showing vt2 expression in the epidermis along the flanks of the inflorescence. (C) Longitudinal section showing vt2 expression in the epidermis of SPM. Weak signal is also detected in the vasculature within the inflorescence. (D) Transverse section showing two SM. The arrow indicates vt2 expression in the epidermis of the SM. (E) Longitudinal section showing SM in the process of producing the outer and inner glumes. The arrow indicates vt2 expression in the epidermis of the inner glume. [See online article for color version of this figure.]
Figure 8.
Figure 8.
vt2 spi1 Double Mutant Analysis. (A) vt2 spi1 plants resemble vt2 single mutants except with a reduction in height. (B) Quantification of plant height. (C) Quantification of leaf number. (D) vt2 spi1 tassels resemble vt2 single mutants except with a reduction in length. (E) vt2 spi1 ears exhibit reduced length and kernel number. (F) Quantification of tassel length. (G) Quantification of tassel branch number. (H) Quantification of tassel spikelet number. (I) Quantification of ear length. (J) Quantification of kernel number. (K) Quantification of visible ear shoot number. Asterisk indicates significant reduction at P < 0.05 compared with either single mutant alone; error bars represent the se; n = 55 normal, 17 spi1, 27 vt2, 7 vt2 spi1 for (B), (C), and (K); n = 10 normal, spi1, and vt2 and 7 vt2 spi1 for (F) to (H); n = 5 each of normal, spi1, vt2, and vt2 spi1 for (I) and (J). [See online article for color version of this figure.]
Figure 9.
Figure 9.
Measurement of Free IAA Levels in Normal, spi1, vt2, and spi1 vt2 Mutants. Free IAA levels were measured in developing leaves of 2-week-old seedlings. Error bars represent the se. n = 5 each of normal, spi1, vt2, and vt2 spi1. One replicate of three is shown. FW, fresh weight.
Figure 10.
Figure 10.
vt2 bif2 Double Mutant Analysis. (A) vt2 bif2 plants (arrow and inset) exhibit a drastic reduction in vegetative growth compared with vt2 or bif2 single mutants. (B) Quantification of plant height. (C) Quantification of leaf number. (D) vt2 bif2 tassels are severely underdeveloped compared with vt2 or bif2 single mutants. (E) Quantification of tassel length. (F) Quantification of ear number. Asterisk indicates significant reduction at P < 0.05 compared with either single mutant alone; error bars represent the se; n = 31 normal, 28 bif2, 18 vt2, and 6 vt2 bif2 for (B), (C), and (F); n = 10 normal, bif2, and vt2 and 8 vt2 bif2 for (E). [See online article for color version of this figure.]

References

    1. Barazesh S., McSteen P. (2008). Barren inflorescence1 functions in organogenesis during vegetative and inflorescence development in maize. Genetics 179: 389–401 - PMC - PubMed
    1. Barazesh S., Nowbakht C., McSteen P. (2009). sparse inflorescence1, barren inflorescence1 and barren stalk1 promote cell elongation in maize inflorescence development. Genetics 182: 403–406 - PMC - PubMed
    1. Barkawi L.S., Tam Y.Y., Tillman J.A., Normanly J., Cohen J.D. (2010). A high-throughput method for the quantitative analysis of auxins. Nat. Protoc. 5: 1609–1618 - PubMed
    1. Bartel B. (1997). Auxin biosynthesis. Annu. Rev. Plant Physiol. 48: 49–64 - PubMed
    1. Bartling D., Seedorf M., Mithöfer A., Weiler E.W. (1992). Cloning and expression of an Arabidopsis nitrilase which can convert indole-3-acetonitrile to the plant hormone, indole-3-acetic acid. Eur. J. Biochem. 205: 417–424 - PubMed

Publication types