. 2011 Feb;23(2):823-42.
doi: 10.1105/tpc.110.082081. Epub 2011 Feb 18.

Proteomics and functional analyses of pepper abscisic acid-responsive 1 (ABR1), which is involved in cell death and defense signaling

Affiliations

Proteomics and functional analyses of pepper abscisic acid-responsive 1 (ABR1), which is involved in cell death and defense signaling

Du Seok Choi et al. Plant Cell. 2011 Feb.

Abstract

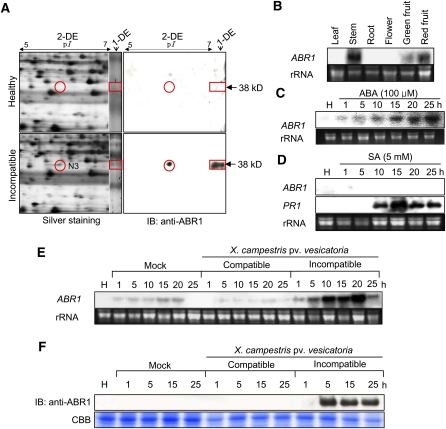
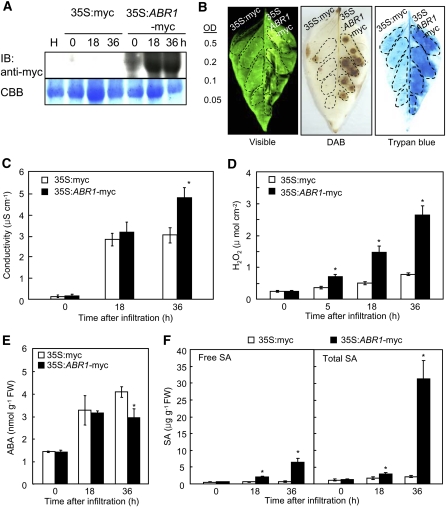
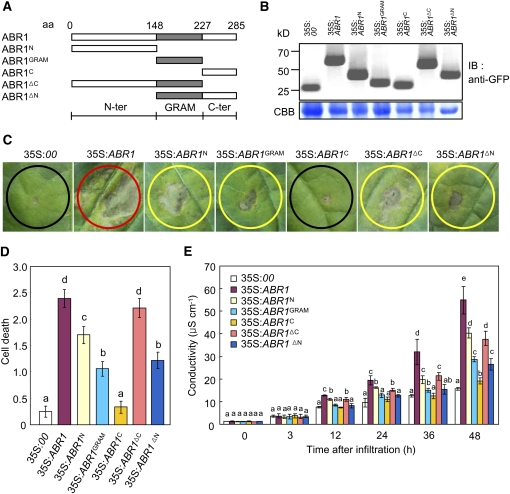
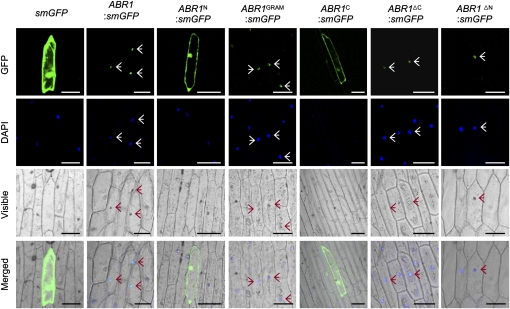
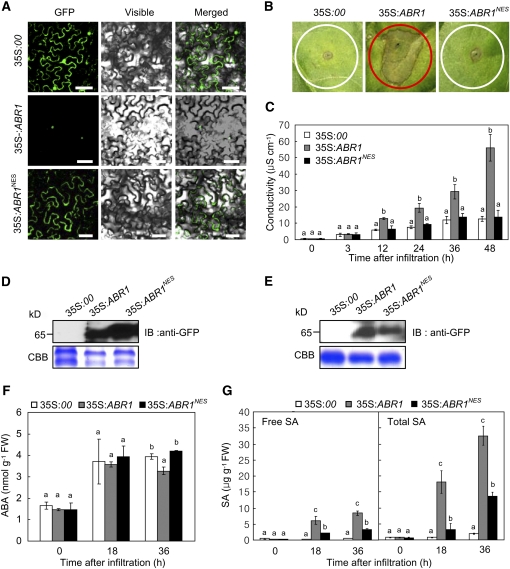
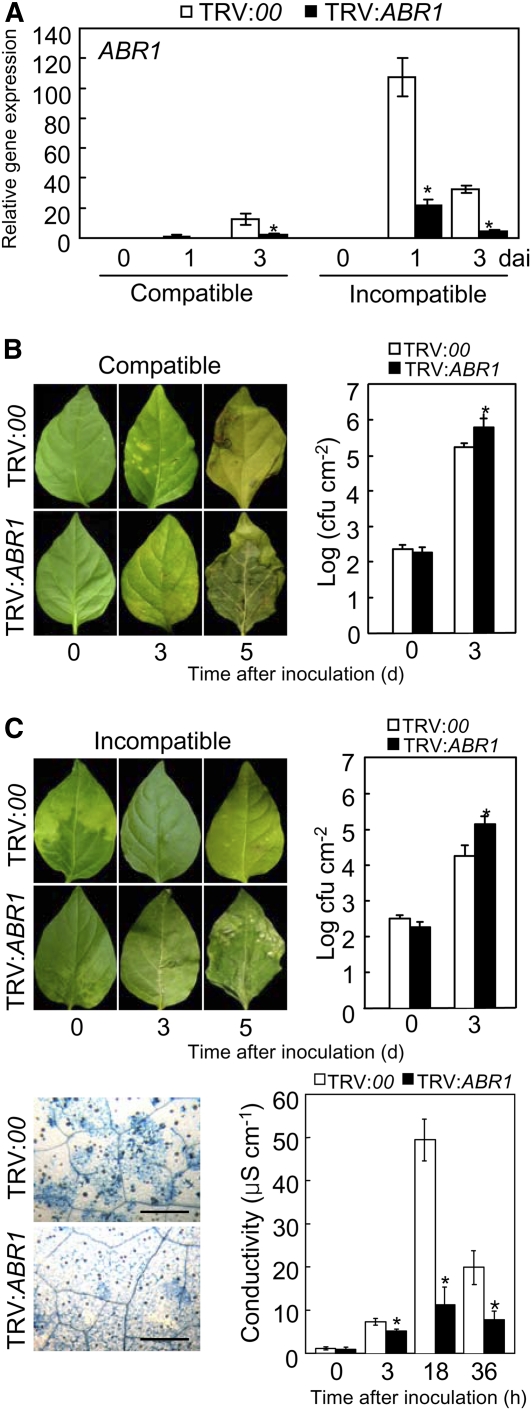
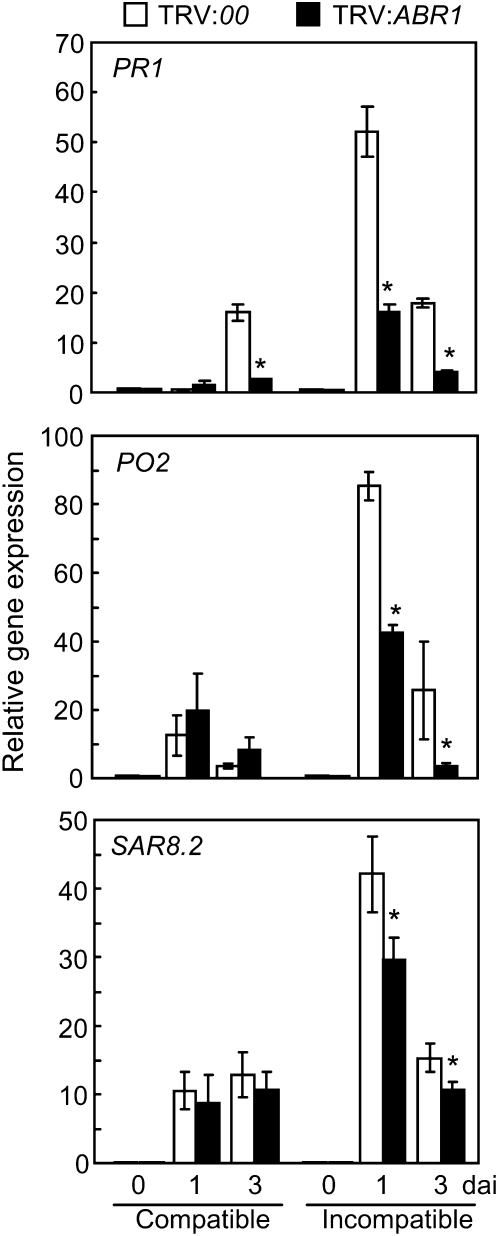
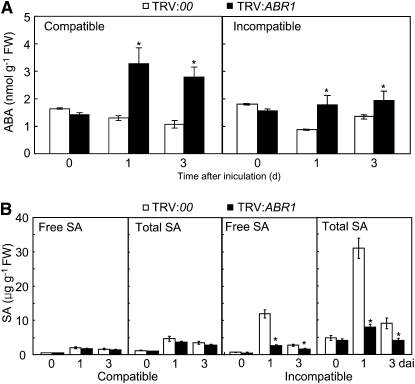
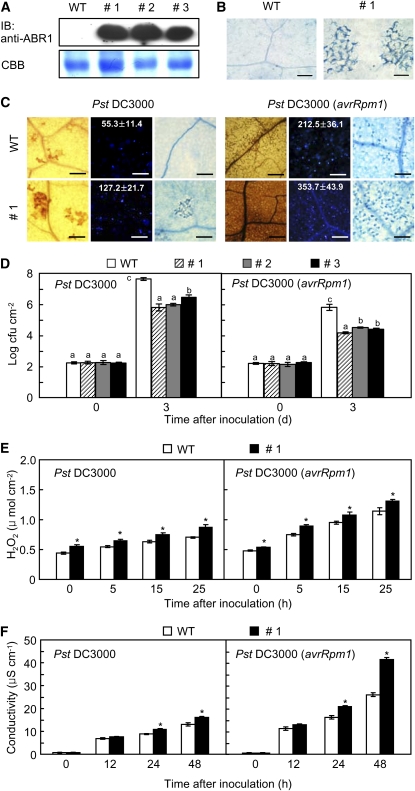
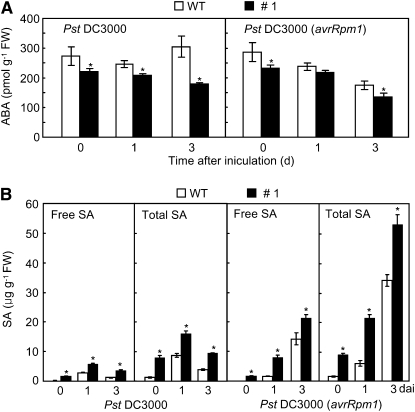
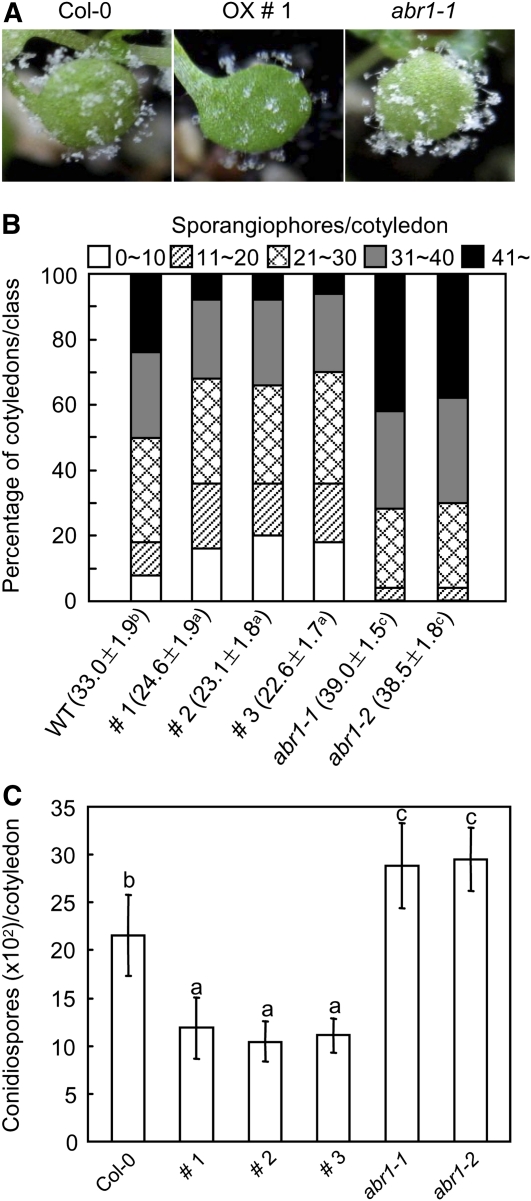
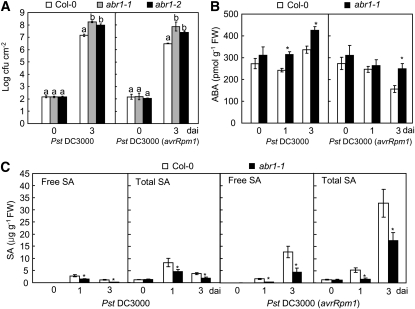
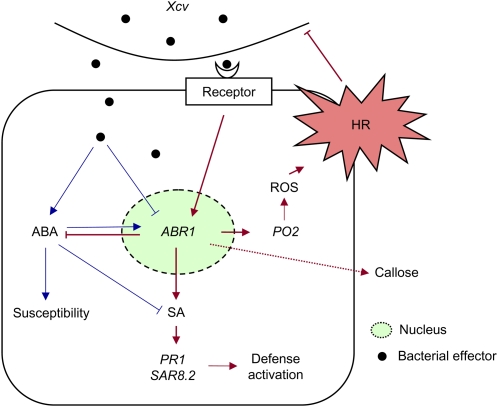
Abscisic acid (ABA) is a key regulator of plant growth and development, as well as plant defense responses. A high-throughput in planta proteome screen identified the pepper (Capsicum annuum) GRAM (for glucosyltransferases, Rab-like GTPase activators, and myotubularins) domain-containing ABA-RESPONSIVE1 (ABR1), which is highly induced by infection with avirulent Xanthomonas campestris pv vesicatoria and also by treatment with ABA. The GRAM domain is essential for the cell death response and for the nuclear localization of ABR1. ABR1 is required for priming cell death and reactive oxygen species production, as well as ABA-salicylic acid (SA) antagonism. Silencing of ABR1 significantly compromised the hypersensitive response but enhanced bacterial pathogen growth and ABA levels in pepper. High levels of ABA in ABR1-silenced plants antagonized the SA levels induced by pathogen infection. Heterologous transgenic expression of ABR1 in Arabidopsis thaliana conferred enhanced resistance to Pseudomonas syringae pv tomato and Hyaloperonospora arabidopsidis infection. The susceptibility of the Arabidopsis ABR1 putative ortholog mutant, abr1, to these pathogens also supports the involvement of ABR1 in disease resistance. Together, these results reveal ABR1 as a novel negative regulator of ABA signaling and suggest that the nuclear ABR1 pool is essential for the cell death induction associated with ABA-SA antagonism.


Figures

Figure 1.
Figure 1.
RNA Gel Blot, 2D, and Immunoblot Analyses of the Expression of the ABR1 Protein and Gene in Pepper Leaves Infected by Xcv or Treated with ABA and SA. (A) Identification of the ABR1 protein by 1D and 2D electrophoresis and immunoblot analysis. The red circles and rectangles indicate ABR1 expression. IB, imunnoblotting. (B) Organ-specific expression of ABR1 in pepper plants. rRNA is used as loading control ([B] to [E]). (C) Expression of ABR1 in leaves at various times after treatment with 100 μM ABA. H, healthy leaves. (D) Expression of ABR1 and PR1 in leaves at various times after treatment with 5 mM SA. Pepper basic pathogenesis-related protein gene (PR1) was used as a comparable control. H, healthy leaves. (E) Expression of the ABR1 gene in pepper leaves at various times after inoculation with the virulent (compatible) strain Ds-1 and the avirulent (incompatible) strain Bv5-4a of Xcv. H, healthy leaves. (F) Immunoblot analysis of expression of ABR1 protein in leaves at various times after inoculation with the Ds-1 and Bv5-4a strains of Xcv. Immunoblotting used a specific antiserum raised against an ABR1 peptide. H, healthy leaves; IB, imunnoblotting; CBB, Coomassie blue. [See online article for color version of this figure.]
Figure 2.
Figure 2.
Effects of Agrobacterium-Mediated Transient Epression of ABR1 on the Cell Death Response of Pepper Leaves. (A) Immunoblot analysis of transiently expressed myc-ABR1 in leaves at different time points after agroinfiltration. An anti-myc antibody was used to detect myc-ABR1 on the immunoblot. IB, imunnoblotting. (B) Induction of the cell death response by transient expression of ABR1. The leaf areas between the lateral veins received the indicated Agrobacterium strain at the indicated OD600. Photographs were taken 36 h after agroinfiltration. The experiment was performed three times with similar results. Visible, visible light image; trypan blue, trypan blue staining. (C) Electrolyte leakage from leaf discsagroinfiltrated with the empty vector control and the ABR1 transient expression construct (OD600 = 0.2). (D) Accumulation of H2O2 in leaves transiently expressing ABR1. (E) and (F) Quantification of ABA (E) and SA (F) levels in empty vector control leaves and in leaves transiently expressing ABR1 after agroinfiltration (OD600 =0 .5). FW, fresh weight. Data are the means ± sd (n = 3) from three independent experiments. Asterisks indicate a significant difference, as determined by the two-tailed t test (P < 0.05) ([C] to [F]). [See online article for color version of this figure.]
Figure 3.
Figure 3.
Deletion Analysis of the GRAM Domain. (A) Schematic of ABR1 structures used in the cell death assay and for protein localization. aa, amino acids. (B) Expression of the ABR1 variant deletion proteins in pepper leaves, as detected by immunoblotting using an anti-GFP antibody. IB, imunnoblotting; CBB, Coomassie blue. (C) Development of cell death responses in pepper leaves caused by infiltrating Agrobacterium (OD600 = 0.5) strains carrying different ABR1 constructs. Agrobacterium carrying an empty vector (35S:00) was used as a control. Red, yellow, and black circles indicate full, partial, and no cell death, respectively. (D) The extent of ABR1 construct-induced PCD is classified with the following scales: 0, no PCD (<10%); 1, weak PCD (10 to 30%); 2, partial PCD (30 to 80%); and 3, full PCD (80 to 100%). The experiments were performed three times with similar results. (E) Electrolyte leakages from leaf discs infiltrated by Agrobacterium (OD600 = 0.5) strains carrying different ABR1 constructs. Error bars represent ± sd (n = 3) from three independent experiments and different letters (a to e) indicate significant differences, as determined by Fisher's protected least significant difference (LSD) test (P < 0.05) ([D] and [E]) [See online article for color version of this figure.]
Figure 4.
Figure 4.
Subcellular Localization of ABR1. GFP fusions of full- or partial-length ABR1 were transiently transformed into onion epidermal cells. The overall schematic structures of each construct are shown in Figure 3A with the addition of a GFP fusion motif at the 3′ termini. The plant nuclei were stained with DAPI. Images were taken using confocal microscopy (GFP fluorescence, green; DAPI fluorescence, blue; visible, visible light image; merged, merged images of above three images). Empty vector (smGFP) transformed cells are shown as a control. Arrows indicate ABR1-localized nuclei. Bar = 100 μm. [See online article for color version of this figure.]
Figure 5.
Figure 5.
The Function of ABR1 Is Dependent on Nuclear Localization. (A) Localization of ABR1- and ABR1NES-GFP fusion proteins in N. benthamiana leaves as visualized by confocal microscopy. GFP, GFP fluorescence; visible, visible light images; merged, merged images of GFP and visible light images. Bars = 50 μm. (B) The ABR1- and ABR1NES-GFP–mediated cell death response in pepper leaves. (C) Quantification of ABR1- and ABR1NES-GFP–mediated cell death by electrolyte leakage measurement from leaf discs. (D) Transient expression of ABR1- and ABR1NES-GFP in N. benthamiana leaves as detected by immunoblotting. (E) Transient expression of ABR1- and ABR1NES-GFP in pepper leaves as detected by immunoblotting. (F) and (G) Quantification of ABA (F) and SA (G) levels in the empty vector control (35S:00) and pepper leaves transiently expressing ABR1- and ABR1NES-GFP after agroinfiltration (OD600 = 0.5). FW, fresh weight. Data are means ± sd (n = 3) from three independent experiments. Different letters indicate significant differences, as determined by Fisher's protected LSD test (P < 0.05) ([C], [F], and [G]). [See online article for color version of this figure.]
Figure 6.
Figure 6.
Enhanced Susceptibility of ABR1-Silenced Pepper Leaves to Xcv Infection. (A) Relative expression of ABR1 transcript using real-time RT-PCR analysis. dai, days after inoculation. (B) and (C) Disease symptoms induced on leaves of empty vector control (TRV:00) or ABR1-silenced (TRV:ABR1) pepper plants 0, 3, and 5 d after inoculation (dai) with the Xcv virulent (compatible) strain Ds1 ([B], left panel) and avirulent (incompatible) strain Bv5-4a ([C], left panel) (106 colony-forming units [cfu] mL−1). Bacterial growth in leaves inoculated with strain Ds1 ([B], right panel) and strain Bv5-4a ([C], right panel) (104 cfu mL−1). Trypan blue staining of leaves ([C], bottom left panel) and electrolyte leakage from leaf discs ([C], bottom right panel) of empty vector and ABR1-silenced plants inoculated with strain Bv5-4a (107 cfu mL−1). Error bars indicate sd (n = 3) from three independent experiments. Asterisks indicate a significant increase in bacterial growth and electrolyte leakage, as determined by the two-tailed t test (P < 0.05) ([A] to [C]). Bar = 500 μm. [See online article for color version of this figure.]
Figure 7.
Figure 7.
Real-Time RT-PCR Analysis of Defense Marker Gene Expression in Empty Vector (TRV:00) and ABR1-Silenced (TRV:ABR1) Pepper Plants. PR1, pepper basic PR-1; PO2, peroxidase; SAR82, SAR8.2. Data are the means ± sd from three independent experiments. Asterisks indicate significant differences in gene expression, as determined by the two-tailed t test (P < 0.05). dai, days after inoculation.
Figure 8.
Figure 8.
Quantification of ABA and SA Levels in VIGS Plants. Data are the means ± sd from three independent experiments. Asterisks indicate significant differences in ABA (A) and SA (B) levels, as determined by the two-tailed t test (P < 0.05). Total SA, free SA plus its glucoside (SAG); FW, fresh weight.
Figure 9.
Figure 9.
Enhanced Resistance of ABR1-OX Transgenic Arabidopsis Plants to Pst Infection. (A) Constitutive protein expression of ABR1 in three lines (#1, #2, and #3) of transgenic plants by immunoblotting (IB). WT, wild type. (B) Spontaneous cell death response in the transgenic leaf tissue. Bars = 100 μm. (C) DAB (1 dai, left), aniline blue (1 dai, middle), and trypan blue staining (2 dai, right) of leaves of wild-type and ABR1-OX plants inoculated with Pst DC3000 and Pst DC3000 (avrRpm1) (107 cfu mL−1). The number of calloses per mm2 is represented with the means ± sd (n = 3) in the box. Bars = 100 μm. (D) Bacterial growth in leaves of wild-type and ABR1-OX plants inoculated with Pst DC3000 and Pst DC3000 (avrRpm1) (5 × 10⁴ cfu mL−1). Data are the means ± sd (n = 3) from three independent experiments. Different letters and asterisks indicate a significant difference, as determined by Fisher’s protected LSD test (P < 0.05) and the two-tailed t test (P < 0.05), respectively ([D] to [F]).
(E) Accumulation of H2O2 in ABR1-OX transgenic Arabidopsis. (F) Electrolyte leakage from seven leaf discs (7 mm in diameter) of wild-type and ABR1-OX transgenic Arabidopsis plants. [See online article for color version of this figure.]
Figure 10.
Figure 10.
Alteration of ABA and SA Levels in ABR1-OX Transgenic Arabidopsis Plants. Endogenous ABA (A) and SA (B) levels in leaves of wild-type (WT) and ABR1-OX (line #1) plants inoculated with Pst DC3000 and Pst DC3000 (avrRpm1) (5× 10⁴ cfu mL−1). Data are the means ± sd from three independent experiments. Asterisks indicate significant differences in ABA and SA levels, as determined by the two-tailed t test (P < 0.05). Total SA, free SA plus its glucoside (SAG); FW, fresh weight.
Figure 11.
Figure 11.
Responses of Arabidopsis ABR1-OX Plants and ABA-Responsive Protein-Like abr1 Mutants to Infection with H. arabidopsidis Isolate Noco2. (A) Visual images of diseased cotyledons 7 d after inoculation. (B) Quantification of asexual sporangiophore formation on cotyledons 7 d after inoculation. The numbers at the bottom indicate the mean sporagiophores/cotyledon ± sd from three independent experiments. Different letters above sd indicate significant difference, as determined by Fisher’s protected LSD test (P < 0.05). The number of sporagiophores per cotyledon was determined and cotyledons were classified into five scales: 0 to 10, 11 to 20, 21 to 30, 31 to 40, and >40. WT, wild type. (C) Numbers of conidiospores produced on >50 cotyledons 7 d after inoculation. Statistical analyses were performed using the LSD test. Different letters above the bars indicate significantly different means (P < 0.05). [See online article for color version of this figure.]
Figure 12.
Figure 12.
Responses of Arabidopsis ABA-Responsive Protein-Like abr1 Mutants to Pst Infection. Bacterial growth (A) and endogenous ABA (B) and SA (C) levels in leaves of wild-type and abr1 plants inoculated with Pst DC3000 and Pst DC3000 (avrRpm1) (5× 10⁴ cfu mL−1). Error bars indicate ± sd (n = 3) from three independent experiments. Different letters above the bars indicate significant difference, as determined by Fisher's protected LSD test (P < 0.05). dai, days after inoculation.
Figure 13.
Figure 13.
Proposed Model of ABA-SA Antagonism in the Xcv–Pepper Interaction. The pepper ABA-responsive protein, ABR1, which localizes to the nucleus, negatively regulates ABA signaling in an SA-dependent manner to resist pathogen attack. Arrows indicate positive regulation and blunt ends denote negative regulation. Blue and red lines show compatible and incompatible interaction events, respectively. [See online article for color version of this figure.]

References

    1. Adie B.A.T., Pérez-Pérez J., Pérez-Pérez M.M., Godoy M., Sánchez-Serrano J.-J., Schmelz E.A., Solano R. (2007). ABA is an essential signal for plant resistance to pathogens affecting JA biosynthesis and the activation of defenses in Arabidopsis. Plant Cell 19: 1665–1681 - PMC - PubMed
    1. Anderson J.P., Badruzsaufari E., Schenk P.M., Manners J.M., Desmond O.J., Ehlert C., Maclean D.J., Ebert P.R., Kazan K. (2004). Antagonistic interaction between abscisic acid and jasmonate-ethylene signaling pathways modulates defense gene expression and disease resistance in Arabidopsis. Plant Cell 16: 3460–3479 - PMC - PubMed
    1. Audenaert K., De Meyer G.B., Höfte M.M. (2002). Abscisic acid determines basal susceptibility of tomato to Botrytis cinerea and suppresses salicylic acid-dependent signaling mechanisms. Plant Physiol. 128: 491–501 - PMC - PubMed
    1. Bahk Y.Y., Kim S.A., Kim J.S., Euh H.J., Bai G.H., Cho S.N., Kim Y.S. (2004). Antigens secreted from Mycobacterium tuberculosis: Identification by proteomics approach and test for diagnostic marker. Proteomics 4: 3299–3307 - PubMed
    1. Choi H.W., Kim Y.J., Hwang B.K. (2011). The hypersensitive induced reaction and leucine-rich repeat proteins regulate plant cell death associated with disease and plant immunity. Mol. Plant Microbe Interact. 24: 68–78 - PubMed

Publication types

MeSH terms

LinkOut - more resources