. 2011 Mar 16;30(6):1149-61.
doi: 10.1038/emboj.2011.35. Epub 2011 Feb 18.

CESTA, a positive regulator of brassinosteroid biosynthesis

Affiliations

CESTA, a positive regulator of brassinosteroid biosynthesis

Brigitte Poppenberger et al. EMBO J. .

Abstract

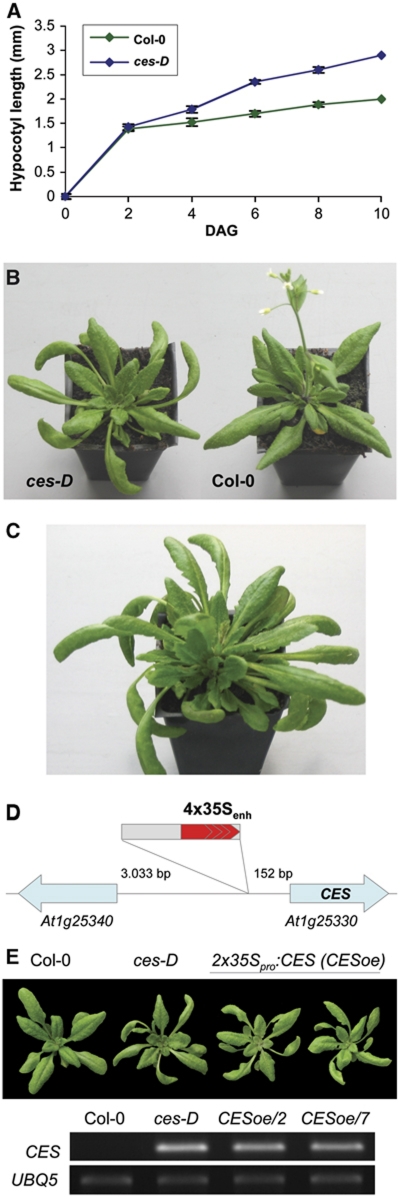
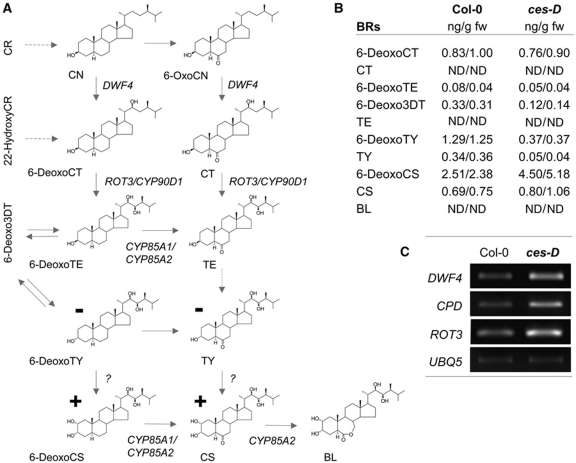
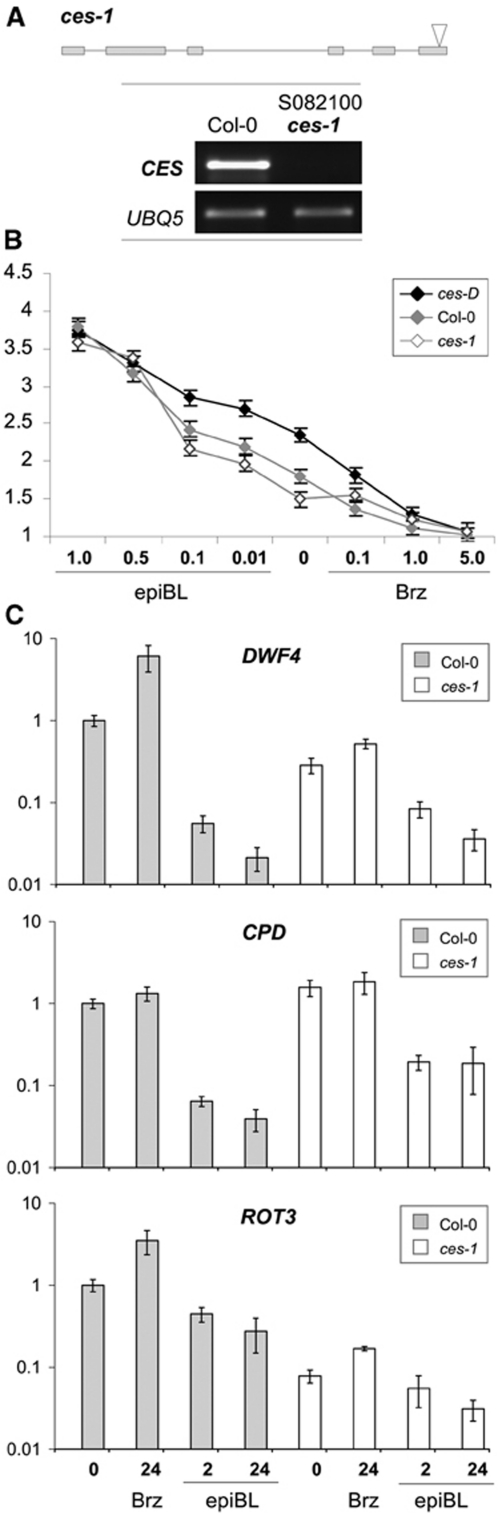
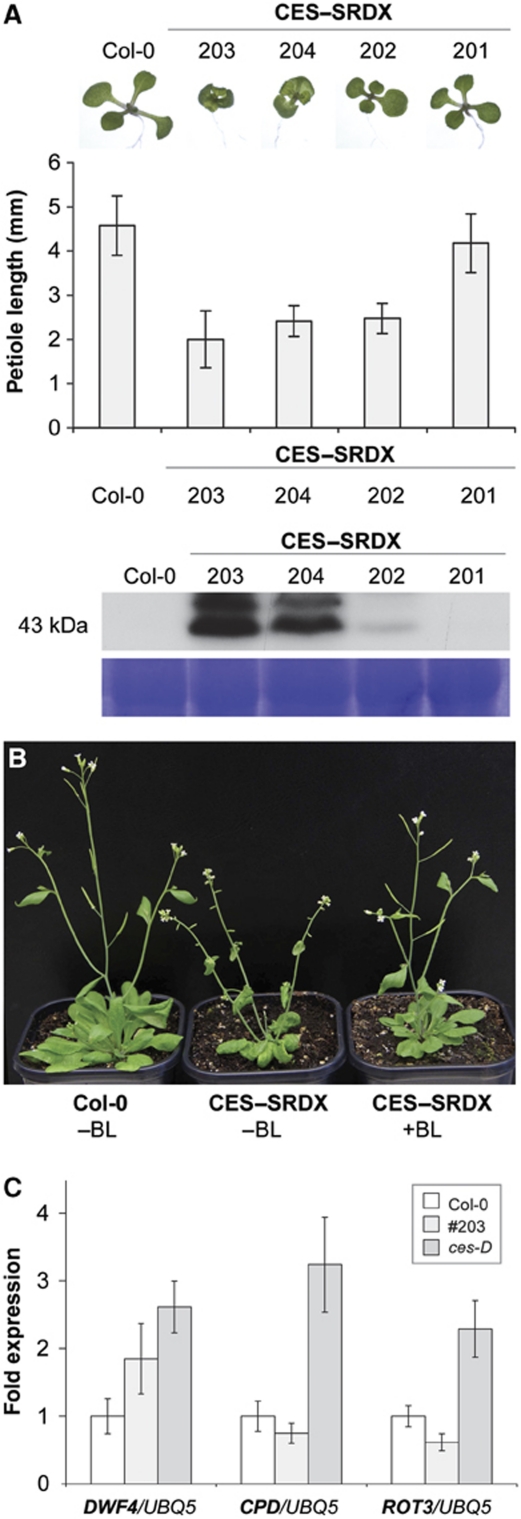
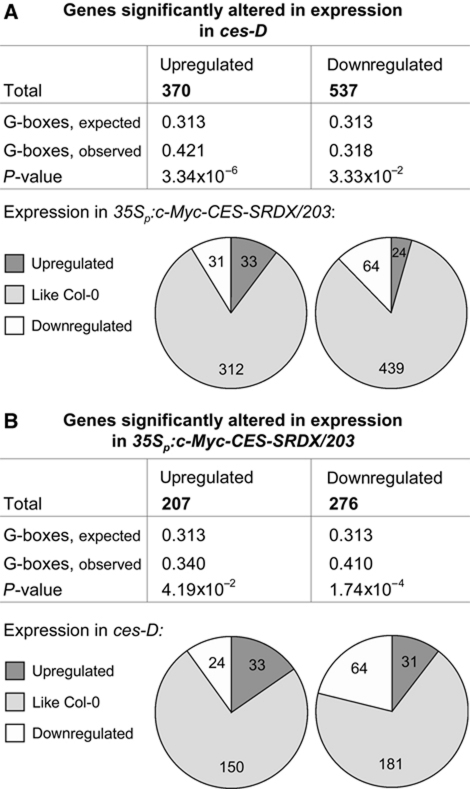
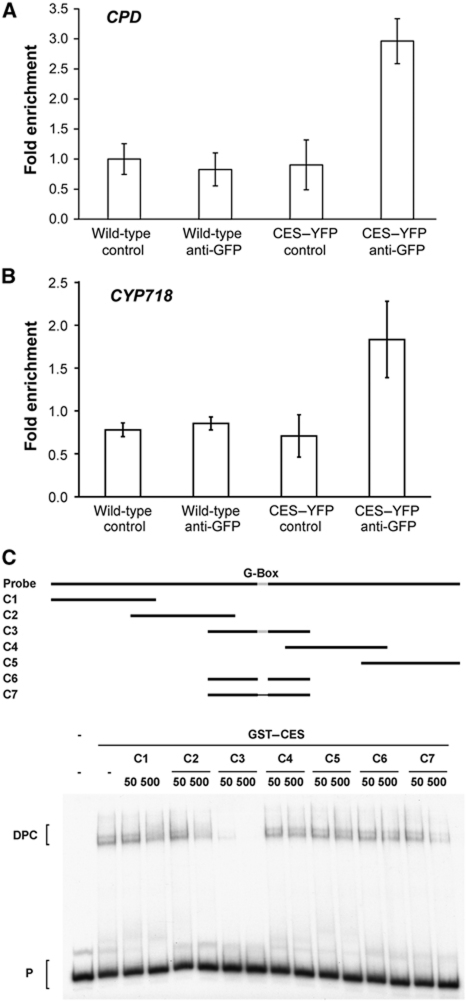
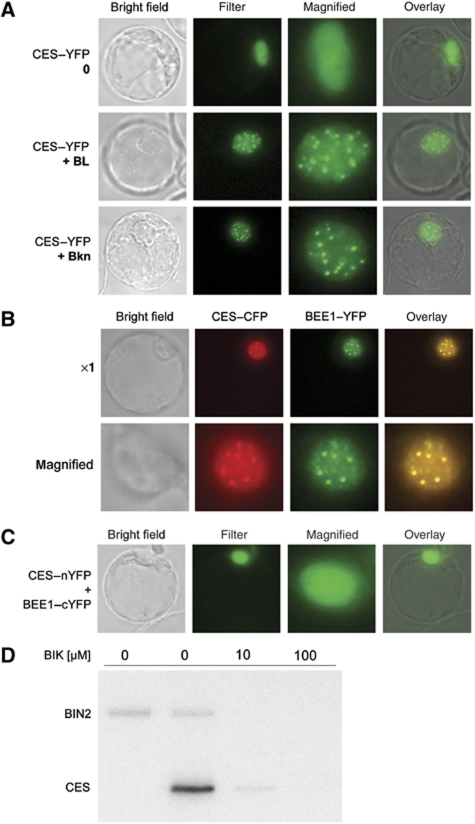
Brassinosteroids (BRs) are steroid hormones that are essential for the development of plants. A tight control of BR homeostasis is vital for modulating their impact on growth responses. Although it is recognized that the rapid adaptation of de novo synthesis has a key role in adjusting required BR levels, our knowledge of the mechanisms governing feedback control is limited. In this study, we identify the transcription factor CESTA as a regulator of BR biosynthesis. ces-D was isolated in a screen of Arabidopsis mutants by BR over-accumulation phenotypes. Loss-of-function analysis and the use of a dominant repressor version revealed functional overlap among CESTA and its homologues and confirmed the role of CESTA in the positive control of BR-biosynthetic gene expression. We provide evidence that CESTA interacts with its homologue BEE1 and can directly bind to a G-box motif in the promoter of the BR biosynthesis gene CPD. Moreover, we show that CESTA subnuclear localization is BR regulated and discuss a model, in which CESTA interplays with BEE1 to control BR biosynthesis and other BR responses.


Conflict of interest statement

The authors declare that they have no conflict of interest.

Figures

Figure 1
Figure 1
Phenotypic and molecular characterization of the ces-D mutant. (A) Hypocotyl length of light-grown wild-type Col-0 (green) and ces-D (blue) seedlings at different time points after germination. Data points are the average of three independent experiments. The standard error is shown. (B) Representative ces-D (left) and wild-type Col-0 (right) plants 30 DAG grown in long-day conditions. (C) Representative adult ces-D plant, grown in the same conditions as in (B), at 42 DAG. (D) Schematic representation of the ces-D mutation. (E) Recapitulation of the ces-D phenotypes. (Top) 4-week-old plants grown in the same conditions as in (B). (From left) Wild type, ces-D and two independent homozygous lines transformed with a 2x35Sp:CES construct. (Bottom) Semi-quantitative RT–PCR analysis of CES expression in 10-day-old seedlings of the plant lines shown. UBQ5 served as an internal control.
Figure 2
Figure 2
CES-GUS expression is present in all organs and is developmentally regulated. A homozygous line expressing a CES-promoter GUS fusion that showed a characteristic staining pattern was chosen for histochemical analysis of CESpro:GUS expression in different organs and developmental stages. (A, B) Dark-grown seedlings 2 DAG and (C) 10 DAG. (D) Light-grown seedling 3 DAG. (E) Root of a light-grown seedling 3 DAG. (F) Shoot of a 14-day-old plant; the arrow indicates a leaf axillary meristem. (G) Leaf of an adult plant. (HJ) Buds and flowers at stages 9–12 (as defined by Smyth et al (1990)).
Figure 3
Figure 3
ces-D acts on BR biosynthesis. (A) Illustration of the BR-biosynthetic pathway (according to Bishop (2007)), indicating changes in the ces-D mutant as compared with wild-type plants (for values see (B)). − denotes decreased; + denotes increased. (B) Endogenous BR levels of adult ces-D plants as compared with those of wild type. Aerial parts of 4-week-old plants were analysed for free BR levels (ng/g fresh weight). For each line, two independent sets of samples were measured and are shown. n.d., not detected (below the detection limit). (C) Semi-quantitative RT–PCR analysis of the expression of DWF4, CPD and ROT3 in 10-day-old ces-D and wild-type seedlings. UBQ5 was used as an internal control.
Figure 4
Figure 4
Identification and characterization of a ces-ko line. (A) (Top) Schematic illustration of the ces-1 mutant. Coding regions are indicated as boxes. The arrow shows the predicted location of the T-DNA insertion. (Bottom) Semi-quantitative RT–PCR analysis of CES expression in 10-day-old seedlings of the ces-1 and those of wild-type Col-0. UBQ5 served as an internal control. (B) Response of ces-1 and ces-D seedlings to externally applied 24-epiBL and Brz2001. Seeds of ces-D, ces-1 and wild-type plants were germinated on medium supplemented with different concentrations of 24-epiBL or Brz2001 and incubated in 50 μmol/m2/s of continuous white light at 21±1°C for 7 days. Data points represent the average of 20 measured hypocotyls. Error bars show the s.e. (C) Response of DWF4, CPD and ROT3 expression in ces-1 and wild-type seedlings to external application of 24-epiBL or Brz2001 (performed as in (B)), analysed by quantitative real-time PCR. CDKA1 was used as an internal control.
Figure 5
Figure 5
Generation and characterization of 35Sp:c-Myc-CES-SRDX plants. (A) Phenotype of plants constitutively expressing a c-Myc–CES–SRDX fusion protein. (Top) Seedlings grown in long-day conditions 5 DAG. (From left to right) Wild type and four independent homozygous lines transformed with a 35Sp:c-Myc-CES-SRDX construct. (Middle) Petiole length of 12-day-old seedlings in mm, measured in three replicates. (Bottom) Western blot analysis of the plants shown using an anti-c-Myc antibody. (B) Adult phenotypes of 35Sp:c-Myc-CES-SRDX/203 plants. Four-week-old plants of wild type, of an untreated 35Sp:c-Myc-CES-SRDX/203 plant, and of a 35Sp:c-Myc-CES-SRDX/203 plant treated with 24-epiBL are shown. (C) Quantitative real-time PCR analysis of the expression of DWF4, CPD and ROT3 in 2-week-old 35Sp:c-Myc-CES-SRDX ces-D and wild-type seedlings. UBQ5 was used as an internal control.
Figure 6
Figure 6
Evaluation of ces-D and 35Sp:c-Myc-CES-SRDX/203 transcriptome analysis. The upstream sequences (3000 bp) were analysed for an enrichment of G-boxes. The default settings of the program motiffinder were used. The data to compile the pie charts were taken from Supplementary Table S1. (A) Illustration of the evaluation of ces-D transcriptome changes. (B) Illustration of the evaluation of 35Sp:c-Myc-CES-SRDX/203 transcriptome changes.
Figure 7
Figure 7
CES binds to G-box motifs. (A, B) ChIP experiments with wild-type and 35Sp:CES-YFP plants using an anti-GFP antibody. G-box containing fragments of the promoters of CPD and CYP718 were quantified by real-time PCR amplification from immunoprecipitated samples, with the primer pairs listed in Supplementary Table S4. The primer pair 5S-F/5S-R (Li et al, 2010) was used for standardization. The standard deviation of at least three measurements is shown. (C) EMSAs analysing CES binding to a fragment of the CPD promoter. A radioactively labelled probe representing the same part of the CPD promoter as in (A) was incubated with GST–CES in the absence or presence of cold competitor oligonucleotides. The competitors C1–C5 contain different regions (indicated by a solid line; upper panel) while the G-box (CACGTG; light grey) was deleted in C6 or mutated to AAAAAA in C7. The competitors were used in 50 and 500-fold molar excess to the probe. P, probe; DPC, DNA–protein complexes.
Figure 8
Figure 8
CES is a nuclear protein that interacts with BEE1 and is phosphorylated by BIN2 in vitro. (A) CES–YFP reporter expression in Arabidopsis protoplasts treated with 24-epiBL (1 μM) or Bkn (30 μM) for 2 h as compared with an untreated control. (B) Colocalization of CES–CFP and BEE1–YFP. Images of a representative protoplast coexpressing 35Sp:CES-CFP and 35Sp:BEE1-YFP, treated for 2 h with 1 μM of 24-epiBL. (C) Bimolecular fluorescence complementation assay showing a representative protoplast cotransformed with CES–nYFP and BEE1–cYFP constructs. (D) In vitro kinase assays using 0.1 μg of GST–BIN2 and 1.0 μg of GST–CES. The reactions were treated for 2 h with increasing concentrations of Bkn. A reaction to which only BIN2 was added served as a negative control.

References

    1. Alonso JM, Stephanova AN, Leiss TJ, Kim CJ, Chen H, Shinn P, Stevenson DK, Zimmerman J, Barajas P, Cheuk R, Gadrinab C, Heller C, Jeske A, Koesema E, Meyers CC, Parker H, Prednis L, Ansari Y, Choy N, Deen H et al. (2003) Genome-wide insertional mutagenesis of Arabidopsis thaliana. Science 301: 653–657 - PubMed
    1. Aufsatz W (2005) Chromatin immunoprecipitation protocol to analyze histone modifications in Arabidopsis thaliana (PROT12) http://www.epigenome-noe.net/WWW/researchtools/protocol.php?protid=13
    1. Bailey PC, Martin C, Toledo-Ortiz G, Quail PH, Huq E, Heim MA, Jakoby M, Werber M, Weisshaar B (2003) Update on the basic helix-loop-helix transcription factor gene family in Arabidopsis thaliana. Plant Cell 15: 2497–2502 - PMC - PubMed
    1. Bancos S, Nomura T, Sato T, Molnar G, Bishop GJ, Koncz C, Yokota T, Nagy F, Szekeres M (2002) Regulation of transcript levels of the Arabidopsis cytochrome p450 genes involved in brassinosteroid biosynthesis. Plant Physiol 130: 504–513 - PMC - PubMed
    1. Belkhadir Y, Chory J (2006) Brassinosteroid signaling: a paradigm for steroid hormone signaling from the cell surface. Science 314: 1410–1411 - PubMed

Publication types

MeSH terms