. 2011 Mar;18(3):372-8.
doi: 10.1038/nsmb.1993. Epub 2011 Feb 20.

Mapping of INS promoter interactions reveals its role in long-range regulation of SYT8 transcription

Affiliations

Mapping of INS promoter interactions reveals its role in long-range regulation of SYT8 transcription

Zhixiong Xu et al. Nat Struct Mol Biol. 2011 Mar.

Abstract

Insulin (INS) synthesis and secretion from pancreatic β-cells are tightly regulated; their deregulation causes diabetes. Here we map INS-associated loci in human pancreatic islets by 4C and 3C techniques and show that the INS gene physically interacts with the SYT8 gene, located over 300 kb away. This interaction is elevated by glucose and accompanied by increases in SYT8 expression. Inactivation of the INS promoter by promoter-targeting siRNA reduces SYT8 gene expression. SYT8-INS interaction and SYT8 transcription are attenuated by CTCF depletion. Furthermore, SYT8 knockdown decreases insulin secretion in islets. These results reveal a nonredundant role for SYT8 in insulin secretion and indicate that the INS promoter acts from a distance to stimulate SYT8 transcription. This suggests a function for the INS promoter in coordinating insulin transcription and secretion through long-range regulation of SYT8 expression in human islets.


Figures
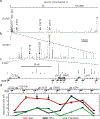
Figure 1
Figure 1
4C-Seq analysis reveals the association of SYT8 with INS gene in human pancreatic islets. 4C-Seq analysis of INS-associated loci in the entire human chromosome 11 (a), the INS nearby region (b) and the SYT8TNNI2 gene locus (c). 4C peaks are shown (a-c), and INS, SYT9, SYT8, SYT13 and SYT7 genes and the H19 ICR are located (a, b). The frequency of two 4C peaks marked with asterisks is larger than 25,000 and truncated. (c) The location of SYT8 and TNNI2 as well as CTSD and LSP1 genes, the 3C PCR primers and the corresponding BglII sites (vertical line) in the SYT8 and TNNI2 locus (lower). The 3C PCR primers are numbered. The exons are marked with solid bars and the transcription direction marked with arrows. Not all of the BglII sites in this region are shown and there is only one BglII site within the CTSD gene. (d) TaqMan quantitative 3C analysis of INS interactions with the SYT8-TNNI2 locus in glucose-treated islets, islets-derived hIPCs and primary human fibroblasts. Plotted are the relative interactions in arbitrary units of the INS gene with eight BglII sites (upper, not in scale), which are numbered as in c and whose location in the region shown in c. The mean ± SEM is shown (n = 8). The sites for the SYT8 promoter and its 3′ downstream site (or the TNNI2 promoter) are marked with arrows.
Figure 2
Figure 2
Glucose stimulates INS interactions with the SYT8-TNNI2 gene locus and increases SYT8 and TNNI2 gene expression in human islets. (a) TaqMan quantitative 3C analysis of the relative interaction of the INS gene with the SYT8 promoter and its 3′ downstream site (or the TNNI2 promoter), marked with arrows, in islets from two donors with and without glucose treatment for 30 min. The mean ± SEM is shown (n = 8). (b) TaqMan quantitative 3C analysis of the interaction of the INS gene with the SYT8 promoter in islets from three donors with and without glucose treatment for 1 h. The SYT8-INS interaction is shown relative to that in islets without glucose treatment. The mean ± SEM is shown (n = 8). (c) Time-course analysis of the interaction of the INS gene with the SYT8 promoter in islets from one other donor treated with glucose for the indicated times. (d) Quantitative real-time RT-PCR (qRT-PCR) analysis of SYT8, TNNI2, SYT7, SYT13 and INS gene expression in islets from three donors with and without glucose treatment for the indicated times. The RNA levels are normalized to those of HPRT1 and the mRNA levels relative to islets at t = 0 are plotted. The mean ± SEM is shown (n = 9).
Figure 3
Figure 3
The INS promoter positively regulates SYT8 and TNNI2 gene expression in human islets. (a) qRT-PCR analysis of INS preRNA E2I2 and mature transcript INS E2 (exon 2) and mature transcripts of SYT8, TNNI2, CTSD, MRPL23 and SYT13 genes in islets from two donors that were treated with non-targeting control siRNA (white bar) or one of the two siRNAs targeting to the INS promoter (black bar). The RNA levels are normalized to those of HPRT1. mRNA levels are plotted relative to control. The mean ± SEM is shown (n = 9). The INS exons are shown and the siRNA-targeting sites are marked with arrows (top). (b) qRT-PCR analysis as in a of the islets from one other donor that were treated separately with either of the two siRNAs targeting to the INS promoter.
Figure 4
Figure 4
CTCF positively regulates SYT8 and TNNI2 gene expression in human islets and is important for the maintenance of the SYT8-INS interaction in human islets and human fibroblasts. (a) qRT-PCR analysis of CTCF, SYT8, TNNI2, SYT7 and INS gene expression in islets from four donors that were treated with non-targeting control or CTCF-specific siRNA. The RNA levels are normalized to those of HPRT1. Plotted are the mRNA levels relative to control. The mean ± SEM is shown (n = 9). (b) TaqMan quantitative 3C analysis of INS-SYT8 interaction in the two same siRNA-treated islets as shown in a. The SYT8-INS interaction is shown relative to control. ***P < 0.0001. (c) qRT-PCR analysis of CTCF gene expression in normal human primary fibroblasts that were treated with control (white bar) or CTCF-specific siRNA (black bar). Shown are the CTCF mRNA levels relative to control. (d) Quantitative ChIP analysis of CTCF occupancy at the SYT8 promoter and the INS 3′ downstream region in human fibroblasts treated as in c. Shown is the CTCF occupancy relative to control. (e) TaqMan quantitative 3C analysis of INS-SYT8 interaction in human fibroblasts treated as in c. Shown is the SYT8-INS interaction relative to control. ***P < 0.0001.
Figure 5
Figure 5
SYT8 is an important regulator of insulin secretion in human islets. (a) qRT-PCR analysis of SYT8 gene expression in islets treated with control (white bar) or SYT8-specific siRNA (black bar). Total RNA was prepared directly from siRNA-treated islets without medium change. The mean ± SEM is shown (n = 9). (b) ELISA analysis of insulin levels in the medium for islets from 5 donors that were separately treated with siRNA as in a. The insulin levels are normalized to the amount of total RNAs made from the treated islets. As insulin levels vary among islets from different donors, the insulin levels relative to control are plotted. The mean ± SEM is shown (n = 20, 4 measures for each of 5 donors); ***P < 0.0001. (c) ELISA analysis of insulin levels in the medium of islets from one donor treated as in b and cultured with 30.5 mM glucose for 30 min. The insulin levels are normalized to the amount of islets necessary to produce 1μg total RNA; ***P < 0.0001. (d) ELISA analysis of insulin levels in the medium of islets from another donor that were treated as in c and cultured with 30.5 mM glucose or 20 mM L-arginine for 30 min. The insulin levels are normalized as in c.***P<0.0001; *P=0.0018. (e) Insulin secretion from siRNA-treated islets that were treated with 30.5 mM glucose and supernatants were collected every 5 min. The mean ± SD is shown (n = 4).

References

    1. Lieberman-Aiden E et al. Comprehensive mapping of long-range interactions reveals folding principles of the human genome. Science 326, 289–93 (2009). - PMC - PubMed
    1. Fullwood MJ et al. An oestrogen-receptor-alpha-bound human chromatin interactome. Nature 462, 58–64 (2009). - PMC - PubMed
    1. Apostolou E & Thanos D Virus Infection Induces NF-kB-dependent interchromosomal associations mediating monoallelic IFN-β gene expression. Cell 134, 85–96 (2008). - PubMed
    1. Hu Q et al. Enhancing nuclear receptor-induced transcription requires nuclear motor and LSD1-dependent gene networking in interchromatin granules. Proc Natl Acad Sci USA 105, 19199–204 (2008). - PMC - PubMed
    1. Lower KM et al. Adventitious changes in long-range gene expression caused by polymorphic structural variation and promoter competition. Proc Natl Acad Sci USA 106, 21771–6 (2009). - PMC - PubMed

Publication types