. 2011 Mar;13(3):310-6.
doi: 10.1038/ncb2172. Epub 2011 Feb 20.

p53 regulates biosynthesis through direct inactivation of glucose-6-phosphate dehydrogenase

Affiliations

p53 regulates biosynthesis through direct inactivation of glucose-6-phosphate dehydrogenase

Peng Jiang et al. Nat Cell Biol. 2011 Mar.

Abstract

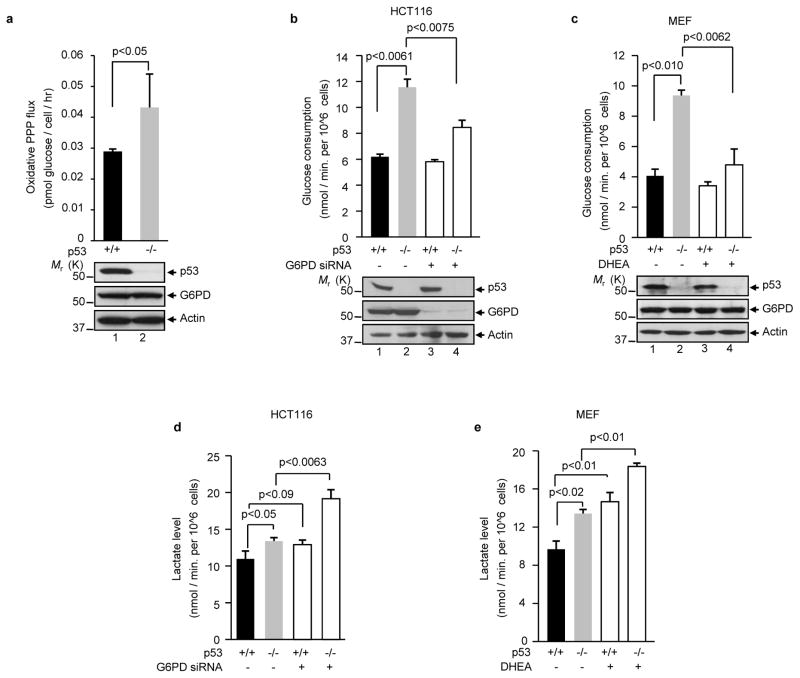
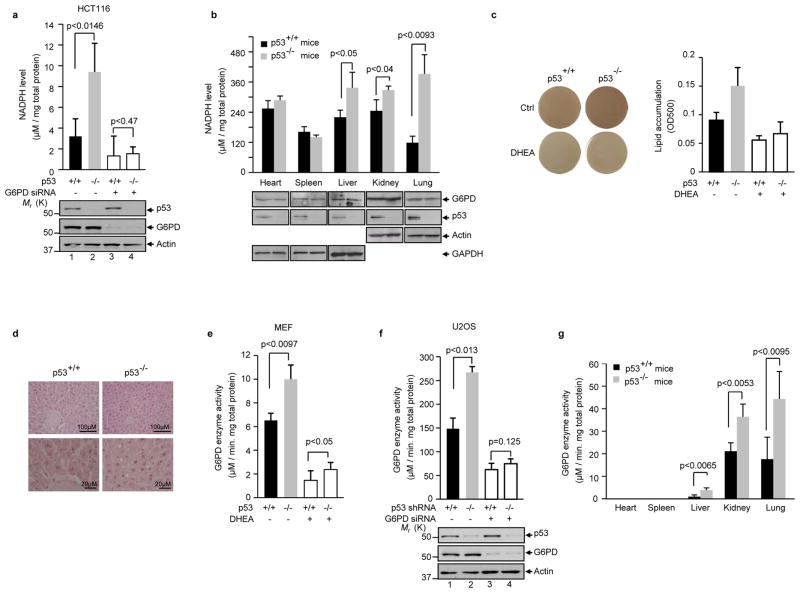
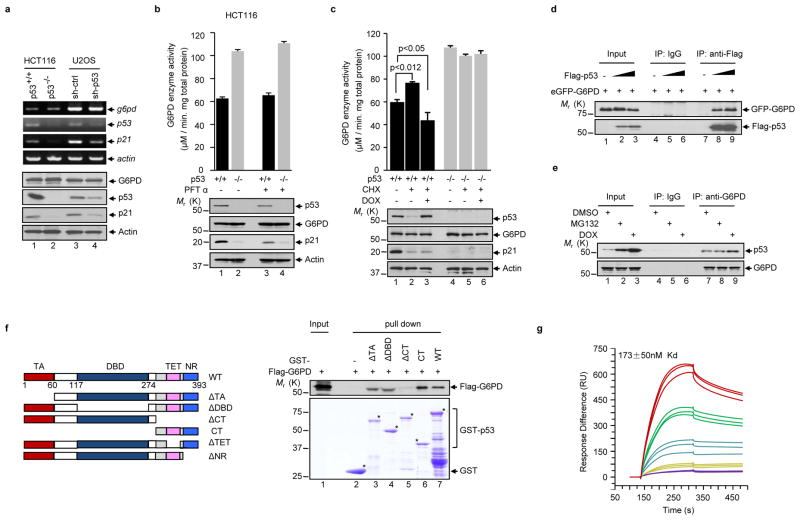
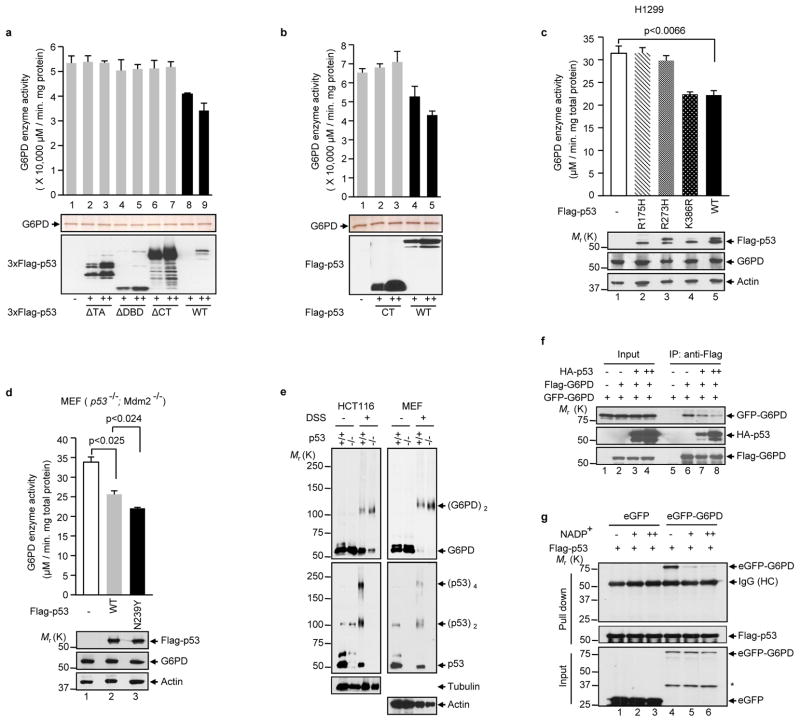
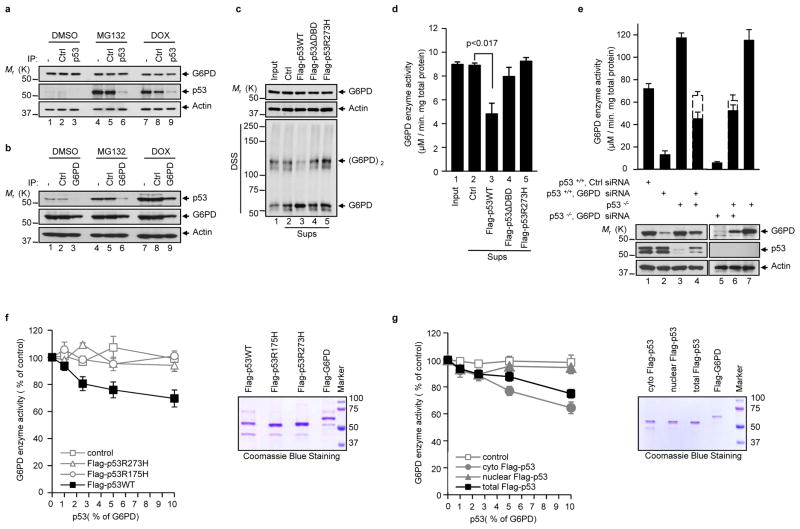
Cancer cells consume large quantities of glucose and primarily use glycolysis for ATP production, even in the presence of adequate oxygen. This metabolic signature (aerobic glycolysis or the Warburg effect) enables cancer cells to direct glucose to biosynthesis, supporting their rapid growth and proliferation. However, both causes of the Warburg effect and its connection to biosynthesis are not well understood. Here we show that the tumour suppressor p53, the most frequently mutated gene in human tumours, inhibits the pentose phosphate pathway (PPP). Through the PPP, p53 suppresses glucose consumption, NADPH production and biosynthesis. The p53 protein binds to glucose-6-phosphate dehydrogenase (G6PD), the first and rate-limiting enzyme of the PPP, and prevents the formation of the active dimer. Tumour-associated p53 mutants lack the G6PD-inhibitory activity. Therefore, enhanced PPP glucose flux due to p53 inactivation may increase glucose consumption and direct glucose towards biosynthesis in tumour cells.


Conflict of interest statement

Competing financial interests: The authors declare no competing financial interests.

Figures

Figure 1
Figure 1. p53 deficiency correlates with increases in PPP flux, glucose consumption, and lactate production
(a) p53+/+ and p53−/− HCT116 cells were cultured in medium containing [2-13C]glucose. Oxidative PPP flux (top) was measured based on the rate of glucose consumption and the ratio of 13C incorporated in to carbon 2 (indicating glycolysis) and carbon 3 (indicating PPP) of lactate by NMR spectroscopy. Molecular weight standards (Mr, in kDa) are indicated on the left. Data shown are means ± S.D. (n=3). (b, d) p53+/+ and p53−/− HCT116 cells were treated with G6PD siRNA and control siRNA (−). Glucose consumption (b, top) and lactate levels (d) are expressed as mean ± standard deviation (SD) of three independent experiments. The expression of p53, G6PD, and actin (a loading control) is shown at the bottom of (b). (c, e) p53+/+ and p53−/− MEF cells were treated with 1 mM DHEA or vehicle (−) for 24 h. Glucose consumption (c, top) and lactate levels (e) are measured. Protein expression is shown at the bottom of (c). Data are means ± S.D. (n=3).
Figure 2
Figure 2. p53 regulates NADPH levels, lipid accumulation, and G6PD activity
(a) NADPH levels (means ± S.D., n=3) in p53+/+ and p53−/− HCT116 cells treated with G6PD siRNA or a control siRNA. Protein expression is shown below. (b) NADPH levels (means ± S.D., n=3) in tissues from p53+/+ and p53−/− mice maintained on a normal diet. Protein expression is shown below. (c) p53+/+ and p53−/− MEF cells treated with or without DHEA were cultured in the presence of insulin, rosiglitazone, isobutylmethylxanthine (IBMX), and dexamethasone. Lipid contents were analyzed by Oil Red O staining. Left: Oil Red O-stained dishes. Right: staining was quantified by OD500nm. Data are means ± S.D. (n=3). (d) Histological sections of liver tissue from p53+/+ and p53−/− mice were stained with hematoxylin and eosin. Arrows indicate fat droplets. (e) G6PD activity (means ± S.D., n=3) in p53+/+ and p53−/− MEFs treated with or without DHEA. (f) U2OS cells stably expressed a p53 shRNA or a control shRNA (−) were transfected with a G6PD siRNA or a control siRNA (−). G6PD activity (top) and protein expression (bottom) were analyzed. Data are means ± S.D. (n=3). (g) G6PD activity in tissues from p53−/− and p53+/+ mice maintained on a normal diet. G6PD activity is the mean ± SD of three p53+/+ or four p53−/− mice.
Figure 3
Figure 3. p53 interacts with G6PD and inhibits its activity independently of transcription
(a) p53+/+ and p53−/− HCT116 cells, and U2OS cells transfected with p53 shRNA and control (ctrl) shRNA, were analyzed by RT-PCR with reverse transcription (top) and western blot (bottom). (b, c) p53+/+ and p53−/− HCT116 cells were treated with or without 20 μM of PFTα for 24 h (b), or treated with or without Dox (2 μM) for 1 h, and then with or without cycloheximide (CHX, 20 μM) for 2 h (c). Cells were analyzed for G6PD activity (top) and protein expression (bottom). Data are means ± S.D. (n=3). (d) H1299 cells were transfected with enhanced GFP-G6PD alone or together with increasing amounts of Flag-p53. Cell lysates were immunoprecipitated with an anti-Flag antibody and an isotype-matching control antibody (IgG). Immunoprecipitated proteins (IP) and 5% input were analyzed by western blot. (e) p53+/+ HCT116 cells were treated with MG132 (20 μM), doxorubicin (DOX, 2 μM), or vehicle (DMSO). Cell lysates were incubated with anti-G6PD antibody or a control antibody (IgG). IP and input were analyzed by western blot. (f) Left: Schematic representation of p53 and its deletion mutants. WT, wild-type; TA, transactivation domain; DBD, DNA-binding domain; CT, C-terminal region; TET, tetramerization domain; NR, negative regulation domain. The amino acids at the domain boundaries are indicated. Right: purified GST fusions of wild type and mutant p53 proteins were incubated separately with recombinant Flag-G6PD protein conjugated to beads. Beads-bound and input proteins were analyzed by western blot using anti-Flag (top) and Coomassie blue staining (bottom). (g) Dissociation constant (KD) for p53 from immobilized G6PD was determined by surface plasmon resonance (BIAcore). A real-time graph of response units (RU) against time is shown. The on rate was 7.53 ± 1.59 × 10³ M−1s−1, and the off rate was 1.30 ± 0.03 × 10⁻³ s−1.
Figure 4
Figure 4. p53 inhibits the formation of dimeric G6PD holoenzyme
(a, b) Activity of the G6PD protein after being incubated with purified wild type or mutant p53 proteins (top). Proteins were analyzed by silver staining (middle) and anti-Flag western blot (bottom). The p53 proteins were tagged with either three copies (a) or one copy (b) of the Flag epitope. Data are means ± S.D. (n=3). (c, d) H1299 cells (c) and p53−/−Mdm2−/− MEFs (d) were transfected separately with wild type and mutant p53 proteins as indicated. G6PD activity (top) and protein expression (bottom) were analyzed. The K386R mutation blocks p53 SUMOylation. Data are means ± S.D. (n=3). (e) Extracts of p53+/+ and p53−/− HCT116 and MEF were treated with and without 5 mM disuccinimidyl suberate (DSS) and analyzed by western blot with antibodies against G6PD, p53, and as controls, tubulin and actin. The positions of various forms of G6PD and p53 are indicated. (f) H1299 cells were transfected with Flag-G6PD, eGFP-G6PD and different amounts of HA-p53. Cell lysates were incubated with anti-Flag antibody. Input and IP were analyzed by western blot. (g) Lysates from p53−/− Mdm2−/− MEFs expressing GFP or GFP-G6PD were incubated with Flag-p53 immobilized on M2 beads or control beads in presence of increasing amounts of NADP+ (0, 0.1, and 1 mM). Input and beads-bound (pull down) proteins were analyzed by western blot.
Figure 5
Figure 5. p53 suppresses G6PD through transient interaction and at substoichiometric ratios
(a, b) p53+/+ HCT116 cells were treated with DMSO, MG132, and DOX. The cytosolic fraction was immunoprecipitated separately with a control antibody (Ctrl) and anti-p53 (a) or G6PD (b) antibody, plus protein A/G beads. The lysates before (−) and after immunoprecipitation were analyzed by western blot. (c, d) Lysates from p53−/− MEF cells were first incubated with Flag-tagged p53 proteins immobilized on beads and control beads, and then were separated from the beads. (c) Levels of proteins (top and middle) and G6PD dimerization (bottom) in the input lysates (Input) and supernatant after being incubated with the beads (Sups). (d) G6PD activity in the input lysates and sups. Data in d are means ± S.D. (n=3). (e) p53+/+ and p53−/− HCT116 cells were either treated separately with G6PD siRNA and a control (Ctr) siRNA, or untreated. Filled columns: actual G6PD activity in the 1:1 mixtures of the indicated lysates (lanes 4 and 6) and in individual lysates (the other lanes). Dashed columns: expected G6PD activity in mixtures based on the averages of the individual lysates. Protein expression is shown at the bottom. The samples were derived from the same conditions. Data are means ± S.D. (n=3). (f, g) Left: Activity of G6PD after being incubated with total wild type and mutant p53 proteins (f) or cytosolic, nuclear, and total wild type p53 (g). p53 proteins were used at molar ratios of 1, 2.5, 5, and 10% that of G6PD. Right: Coomassie blue staining of purified proteins. Data are means ± S.D. (n=3).

Comment in

References

    1. Warburg O, Posener K, Negelein E. Ueber den Stoffwechsel der Tumoren. Biochem Z. 1924;152:319–344.
    1. Warburg O. On the origin of cancer cells. Science. 1956;123:309–314. - PubMed
    1. DeBerardinis RJ, Lum JJ, Hatzivassiliou G, Thompson CB. The biology of cancer: metabolic reprogramming fuels cell growth and proliferation. Cell Metab. 2008;7:11–20. - PubMed
    1. Vander Heiden MG, Cantley LC, Thompson CB. Understanding the Warburg effect: the metabolic requirements of cell proliferation. Science. 2009;324:1029–1033. - PMC - PubMed
    1. Berg JM, Tymoczko JL, Stryer L. Biochemistry. 2007:577–589. - PubMed

Publication types