. 2011 Mar;13(3):292-302.
doi: 10.1038/ncb2170. Epub 2011 Feb 20.

Interplay between oncogene-induced DNA damage response and heterochromatin in senescence and cancer

Affiliations

Interplay between oncogene-induced DNA damage response and heterochromatin in senescence and cancer

Raffaella Di Micco et al. Nat Cell Biol. 2011 Mar.

Abstract

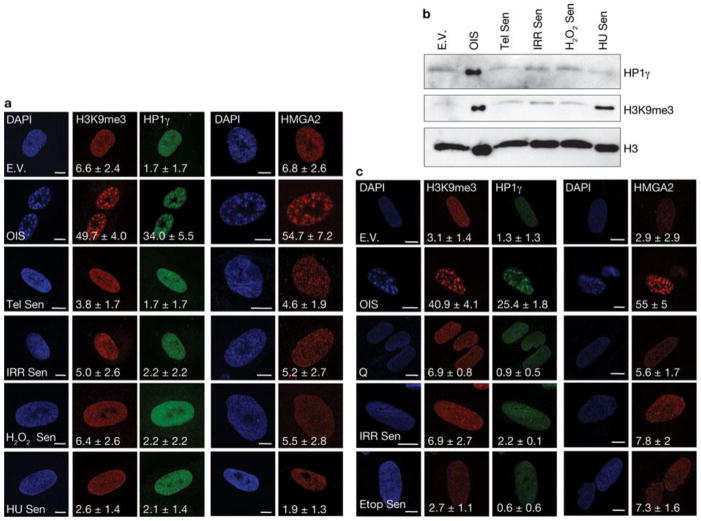
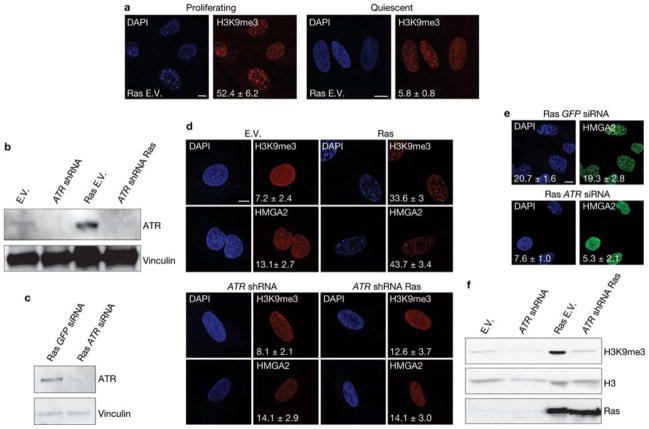
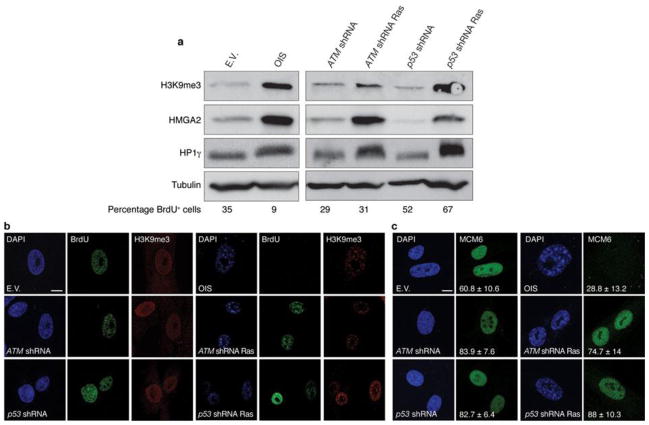
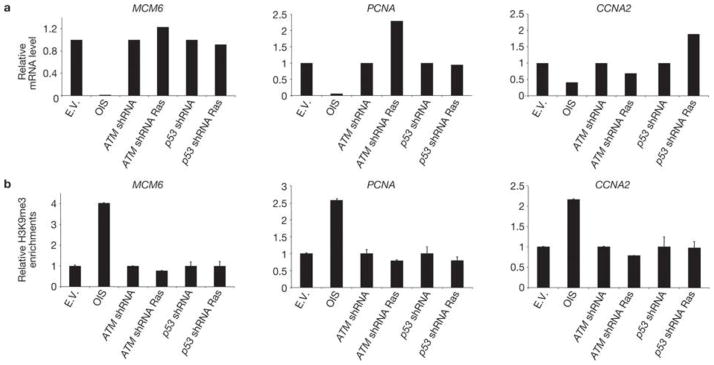
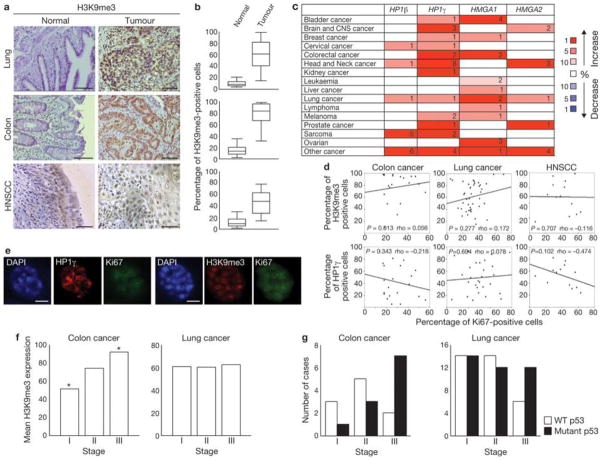
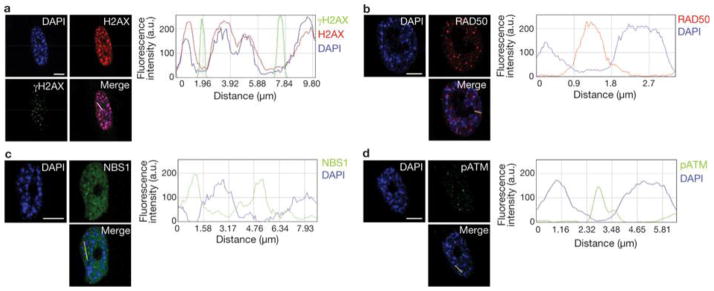
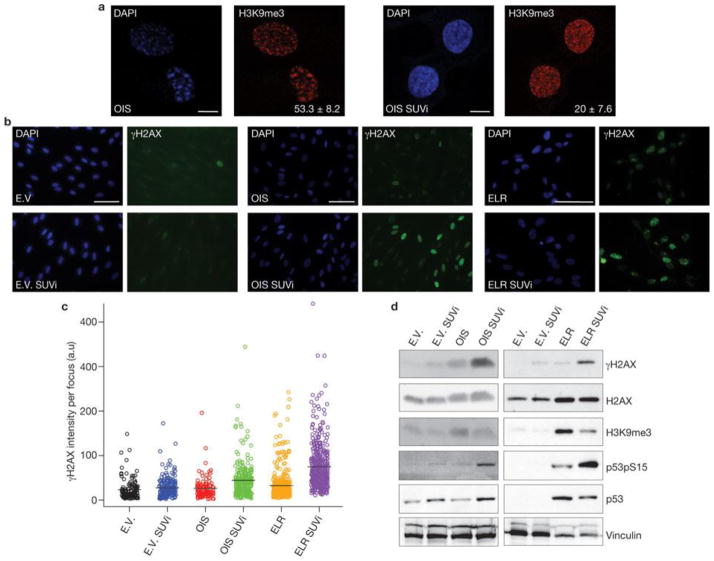
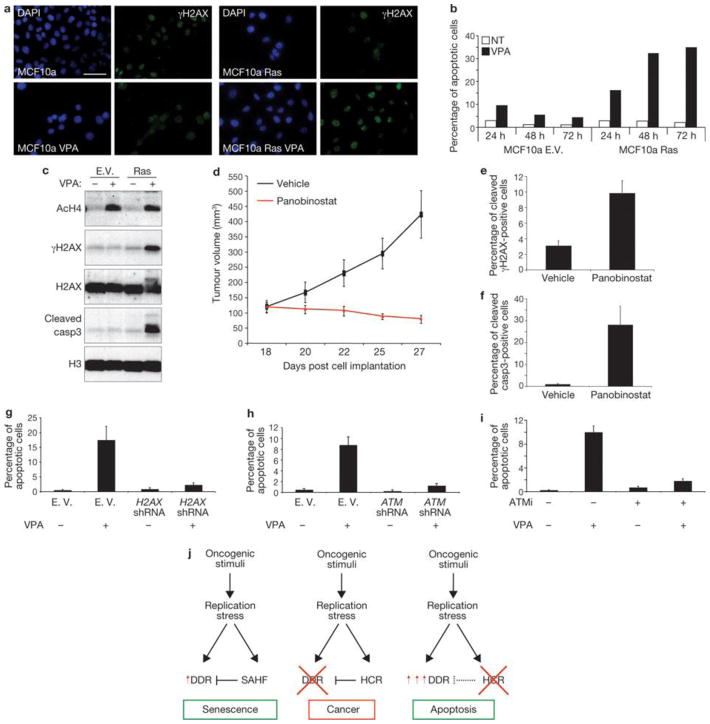
Two major mechanisms have been causally implicated in the establishment of cellular senescence: the activation of the DNA damage response (DDR) pathway and the formation of senescence-associated heterochromatic foci (SAHF). Here we show that in human fibroblasts resistant to premature p16(INK4a) induction, SAHF are preferentially formed following oncogene activation but are not detected during replicative cellular senescence or on exposure to a variety of senescence-inducing stimuli. Oncogene-induced SAHF formation depends on DNA replication and ATR (ataxia telangiectasia and Rad3-related). Inactivation of ATM (ataxia telangiectasia mutated) or p53 allows the proliferation of oncogene-expressing cells that retain increased heterochromatin induction. In human cancers, levels of heterochromatin markers are higher than in normal tissues, and are independent of the proliferative index or stage of the tumours. Pharmacological and genetic perturbation of heterochromatin in oncogene-expressing cells increase DDR signalling and lead to apoptosis. In vivo, a histone deacetylase inhibitor (HDACi) causes heterochromatin relaxation, increased DDR, apoptosis and tumour regression. These results indicate that heterochromatin induced by oncogenic stress restrains DDR and suggest that the use of chromatin-modifying drugs in cancer therapies may benefit from the study of chromatin and DDR status of tumours.


Conflict of interest statement

Competing financial interests

S.M. has stocks in Genextra Spa, a biopharmaceutical company that is currently developing HDAC inhibitors for cancer therapy.

Figures

Figure 1
Figure 1. SAHF are preferentially formed on oncogene-induced senescence in human normal fibroblasts
(a) Immunostaining microscopy of SAHF markers (H3K9me3, HP1γ and HMGA2) in human fibroblasts (BJ cells) after induction of senescence through exposure of cells to different genotoxic stimuli. SAHF are preferentially detected in OIS cells. Numbers indicate percentage of SAHF-positive cells (means ± s.e.m.).; n = 3. Cell treatments: E.V., cells transfected with empty vector; OIS, oncogene-induced senescence through H-RasV12 expression; Tel Sen, telomere shortening; IRR Sen, ionizing radiation; H2O2 Sen, treatment with H2O2; HU Sen, hydroxyurea treatment. (b) Immunoblot analysis of heterochromatic markers in BJ cells exposed to the indicated treatments. Heterochromatic markers accumulate preferentially in OIS cells. Histone H3 is used as a loading control. (c) Representative immunofluorescence microscopy images of SAHF markers (H3K9me3, HP1γ and HMGA2) in BJ cells treated as indicated. Q, quiescent cells; IRR Sen indicates repeated exposure to ionizing radiation, Etop Sen, chronic treatment with etoposide. SAHF markers accumulate preferentially in OIS cells but not in cells repeatedly exposed to irradiation or chronically treated with etoposide. Numbers indicate percentage of SAHF-positive cells (means ± s.e.m.); n = 3. Scale bars, 10 μm. Uncropped images of blots are shown in Supplementary Fig. S9.
Figure 2
Figure 2. SAHF formation requires DNA replication and is dependent on ATR
(a) Oncogene-induced SAHF accumulation, as detected by immunostaining for H3K9me3, in proliferating (left) and quiescent (right) cells. Oncogene-induced SAHF accumulation requires DNA replication. Numbers indicate percentage of SAHF-positive cells (means ± s.e.m.); n = 3. (b, c) Immunoblot analysis shows the efficiency of stable ATR knockdown in cells with ATR shRNA (b) or ATR siRNA (c) and expressing Ras as indicated. GFP siRNA is a control and vinculin is used as a loading control. (d) Immunostaining microscopy of H3K9me3 and HMGA2 shows that on stable depletion of ATR (bottom) Ras-induced SAHF formation is impaired. Numbers indicate percentage of SAHF-positive cells (means ± s.e.m.); n = 3. (e) Formation of SAHF containing HMGA2 is impaired in oncogene-expressing cells on transient ATR downregulation by siRNA. GFP siRNA was used as a control. Numbers indicate percentage of SAHF-positive cells (means ± s.e.m.); n = 3. Scale bars, 10 μm. Uncropped images of blot are shown in Supplementary Fig. S9. (f) Immunoblot analysis reveals a reduced induction of H3K9me3 in ATR-deficient oncogene-expressing cells. Oncogenic Ras is expressed at comparable levels in empty vector and ATR-deficient oncogene-expressing cells. Histone H3 is used as a loading control. E.V.; cells transduced with empty vector. Uncropped images of blots are shown in Supplementary Fig. S9.
Figure 3
Figure 3. Increased heterochromatin in DDR-deficient oncogene-expressing cells is compatible with cellular proliferation
(a) Immunoblot analyses of heterochromatic markers in OIS cells (left) and in proliferating DDR-deficient oncogene-expressing cells (right). Percentage of BrdU-positive cells is indicated (bottom). (b) Confocal microscopy imaging of DAPI and heterochromatin staining in OIS cells and proliferating DDR-deficient oncogene-expressing cells. Single-cell analysis reveals ongoing DNA replication, as detected by BrdU incorporation, in DDR-deficient oncogene-expressing cells displaying DAPI-dense and H3K9me3-enriched regions resembling SAHF structures. (c) Single-cell immunofluorescence microscopy analyses of MCM6 staining in OIS cells and proliferating DDR-deficient oncogene-expressing cells. MCM6 is present in proliferating DDR-inactivated oncogene-expressing cells bearing high levels of heterochromatin. Numbers indicate percentage of SAHF-positive cells (means ± s.e.m.); n = 3. Scale bars, 10 μm. Uncropped images of blots are shown in Supplementary Fig. S9.
Figure 4
Figure 4. E2F target genes are not repressed by heterochromatin induction in DDR-deficient oncogene-expressing cells
(a) qRT–PCR analyses show that, despite increased global heterochromatin, E2F-target genes (MCM6,PCNA and CCNA2) are not repressed in DDR-deficient oncogene-expressing cells. mRNA levels were normalized to the levels in cells transduced with empty vector. (b) Quantitative ChIP results for H3K9me3 from the promoter regions of three E2F-target genes analysed in a. H3K9me3 levels are expressed as a percentage of the non-immunoprecipitated DNA (input), normalized to the percentage of the total immunoprecipitated histone H3 (to correct for nucleosome variations) and further normalized to the levels in cells transduced with empty vector. These results are representative of three independent experiments.
Figure 5
Figure 5. Increased heterochromatin is retained in human tumours in vivo in different stages of cancer progression
(a) Immunohistochemistry analysis of lung, colon (scale bars, 200 μm) and HNSCC (scale bars, 100 μm) samples. Tumoral sections show increased accumulation of H3K9me3, compared with normal epithelium. (b) Box plots indicate the percentage of H3K9me3-positive cells in normal epithelium (left box) and tumour samples (right box). Error bars represent 95% confidence intervals. For all cancer types, P < 0.001 for normal versus tumoral tissues; Mann-Whitney test was used for this analysis. Lung, n = 42; colon, n = 20; head and neck, n = 15. The data for the box plots derive from the immunohistochemical analyses in a. (c) Summary of HP1γ, HP1β, HMGA1 and HMGA2 expression analyses using data from the Oncomine database. Heterochromatin components are upregulated in several human cancers, compared with normal tissues. Numbers in the table indicate numbers of studies with a threshold of P < 0.0001 for normal versus tumoral tissues and with a threshold of expression fold change ≥ 2. Genes are further classified according to expression fold change. The percentage indicates whether the fold change in the expression of the gene is included among 1%, 5% or 10% of the genes most upregulated or downregulated. Increase or decrease is visualized by the colour code. Note: an analysis may be counted in more than one cancer type. (d) Scatter plots indicate the correlation between Ki67 expression and H3K9me3 (top) and HP1γ (bottom) expression, in colon, lung and HNSCC cells. P values (> 0.05 in all cases) and Spearman Correlation (rho) are indicated. (e) Immunofluorescence microscopy of heterochromatin markers at single-cell level in HNSCC samples. H3K9me3- or HP1γ-positive structures can be seen in Ki67-expressing cells. Scale bars, 4 μm. (f) H3K9me3 expression in colon and lung carcinomas at different stages. Histograms indicate that H3K9me3 expression in colon and lung carcinomas is not reduced at more advanced stages. H3K9me3 expression is significantly increased in stage III colon carcinomas in comparison to stage I cases (Asterisk indicates P < 0.05, One-way ANOVA). No statistical significant differences were detected among the tumoral stages in lung cancer. (g) Histograms indicate the progressive loss of wild-type p53 or the progressive increase of p53 mutant cases in later stages of colon and lung carcinomas. Colon, n= 21; lung, n = 66.
Figure 6
Figure 6. SAHF and DDR markers coexist in OIS cells but do not colocalize
(a) Left: DAPI staining and immunostaining for H2AX and γH2AX in OIS cells. Right: quantification of DAPI, H2AX and γH2AX signal intensity across the indicated line in the merge image. Line traces were generated with the line drawn through the brightest DAPI-dense regions. Heterochromatin and γH2AX do not colocalize. (bd) Left: DAPI staining and immunostaining for RAD50 (b), NSB1 (c) and pATM (d). Right: quantification of DAPI, and RAD50, NSB1 and pATM signal intensity across the indicated lines in the merge images. Line traces were generated with the line drawn through the brightest DAPI-stained regions. SAHF do not colocalize in OIS cells with the DNA-damage sensors RAD50, NBS1 and pATM. DAPI staining and immunostaining in OIS cells reveal that DDR factors are excluded from SAHF. Scale bars, 10 μm.
Figure 7
Figure 7. Heterochromatin induction restrains oncogene-induced DDR signalling
(a) SUVi treatment results in loss of H3K9me3 foci. Representative immunofluorescence microscopy images of OIS cells without (left) or with (right) SUVi treatment, and incubated with DAPI and antibodies against H3K9me3. Numbers indicate percentage of SAHF-positive cells (means ± s.e.m.); n = 3. Scale bars, 10 μm. (b) Heterochromatin perturbation by SUVi in oncogene-expressing cells leads to increasedγH2AX signalling in OIS and ELR cells, as detected by immunofluorescence microscopy. E.V. and OIS scale bars, 100 μm; ELR scale bars, 30 μm. (c) Quantification of the integrated intensity of γH2AX per individual focus in control and oncogene-expressing cells on SUVi treatment, as evaluated by high-throughput microscopy. Black bars indicate mean values. OIS versus OIS SUVi and ELR versus ELR SUVi; P < 0.001; pairwise Mann-Whitney, non-parametric test, Benjamini Hochberg P-value adjustment. (d) Immunoblotting analysis of levels of γH2AX and p53 phosphorylated at Ser 15 (p53pS15) in the indicated cells. Heterochromatin perturbation by SUVi leads to increased DDR signalling in oncogene-expressing cells. H3K9me3 antibody is used as a control for SUV39h1 methyltransferase inhibition. H2AX and vinculin are used as loading controls. Uncropped images of blots are shown in Supplementary Fig. S9.
Figure 8
Figure 8. Oncogene-induced heterochromatin formation prevents apoptosis by restraining oncogene-induced DDR signalling
(a) Immunofluorescence microscopy of MCF10a cells expressing Ras and treated with VPA as indicated. Heterochromatin perturbation by valproic acid (VPA, a HDACi) in oncogenic Ras-expressing MCF10a breast epithelial cells leads to increased γH2AX signalling. (b) FACS analysis of the sub-G1 fraction of MCF10a cells reveals increased apoptosis specifically in proliferating oncogene-expressing epithelial cells treated with VPA. In cells treated with VPA there is increased apoptosis specifically in proliferating oncogene-expressing epithelial cells. (c) Immunoblot analysis shows increased DDR activation and induction of cleaved caspase3 in oncogene-expressing MCF10a cells, compared with control cells, following VPA treatment. Acetylated H4 is used as a control for efficacy of VPA treatment. Histone H3 and histone H2AX are used as loading controls. (d) Tumour volumes of an in vivo colon cancer tumour xenograft treated with panobinostat, a HDACi. Panobinostat treatment leads to growth inhibition and regression of tumour volumes. Vehicle-treated tumours keep proliferating as shown by growth curve indicating the tumour growth of vehicle- or panobinostat-treated mice. Data are means ± s.e.m.; n = 7; P < 0.02, treated versus control, two tailed t-test. (e, f) Quantification of γH2AX- and cleaved caspase-3-positive cells as detected by immunohistochemistry analysis of colon tumour cells of vehicle- or panobinostat-treated mice. Data are means ± s.e.m., n = 3. (gi) Quantification of TUNEL-positive HCT116 cells following H2AX knockdown (g), ATM-knockdown (h) and treatment with ATM inhibitor (i). Following HDACi treatment there is a reduced induction of apoptosis in cells with H2AX and ATM knockdown, and in cells treated with ATM inhibitor. Data are means ± s.e.m.; n = 3. (j) Proposed model of the events following oncogene activation. Oncogene activation through DNA-replication stress leads to OIS associated with DDR activation, global induction of heterochromatin (HCR) and SAHF formation. SAHF restrains DDR activity. DDR inactivation allows proliferation and transformation of oncogene-expressing cells maintaining heterochromatin induction. Heterochromatin perturbation, relieving heterochromatin inhibitory effect on DDR, increases DDR signalling and leads to apoptosis. Scale bars, 10 μm. Uncropped images of blots are shown in Supplementary Fig. S10.

Comment in

  • A damage limitation exercise.
    Ivanov A, Adams PD. Ivanov A, et al. Nat Cell Biol. 2011 Mar;13(3):193-5. doi: 10.1038/ncb0311-193. Nat Cell Biol. 2011. PMID: 21364567

References

    1. Collado M, Blasco MA, Serrano M. Cellular senescence in cancer and aging. Cell. 2007;130:223–233. - PubMed
    1. Campisi J, d’Adda di Fagagna F. Cellular senescence: when bad things happen to good cells. Nat Rev Mol Cell Biol. 2007;8:729–740. - PubMed
    1. Adams PD. Healing and hurting: molecular mechanisms, functions and pathologies of cellular senescence. Mol Cell. 2009;36:2–14. - PubMed
    1. d’Adda di Fagagna F, et al. A DNA damage checkpoint response in telomere-initiated senescence. Nature. 2003;426:194–198. - PubMed
    1. Herbig U, Jobling WA, Chen BP, Chen DJ, Sedivy JM. Telomere shortening triggers senescence of human cells through a pathway involving ATM, p53, and p21(CIP1), but not p16(INK4a) Mol Cell. 2004;14:501–513. - PubMed

Publication types