Comparative Study
. 2011 May;43(5):741-50.
doi: 10.1002/mus.21972. Epub 2011 Feb 17.

Isolation and transcriptome analysis of adult zebrafish cells enriched for skeletal muscle progenitors

Affiliations
Free PMC article
Comparative Study

Isolation and transcriptome analysis of adult zebrafish cells enriched for skeletal muscle progenitors

Matthew S Alexander et al. Muscle Nerve. 2011 May.
Free PMC article

Abstract

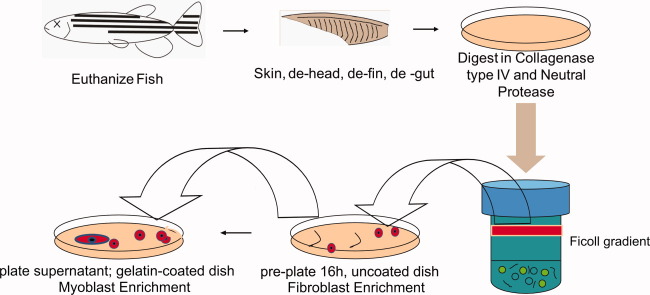
Introduction: Over the past 10 years, the use of zebrafish for scientific research in the area of muscle development has increased dramatically. Although several protocols exist for the isolation of adult myoblast progenitors from larger fish, no standardized protocol exists for the isolation of myogenic progenitors from adult zebrafish muscle.

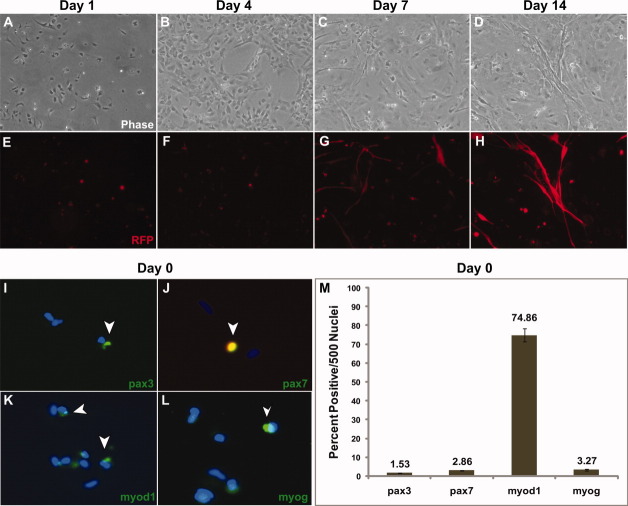
Methods: Using a variant of a mammalian myoblast isolation protocol, zebrafish muscle progenitors have been isolated from the total dorsal myotome. These zebrafish myoblast progenitors can be cultured for several passages and then differentiated into multinucleated, mature myotubes.

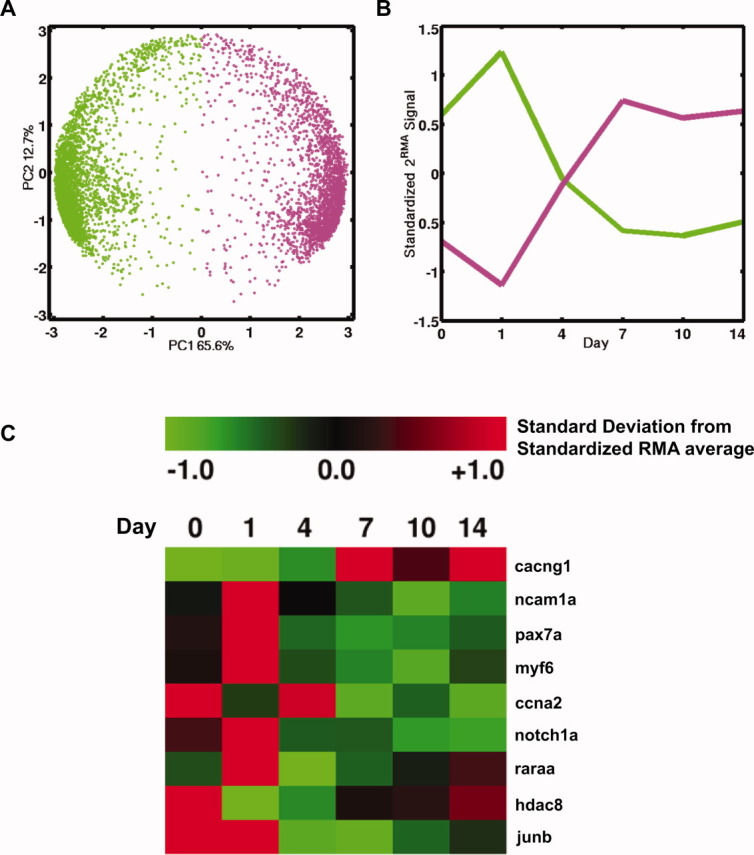
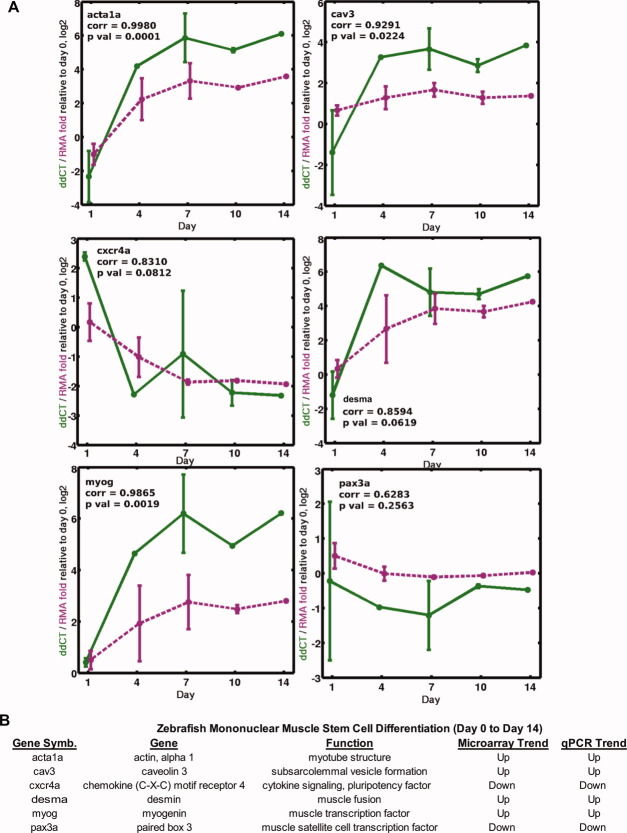
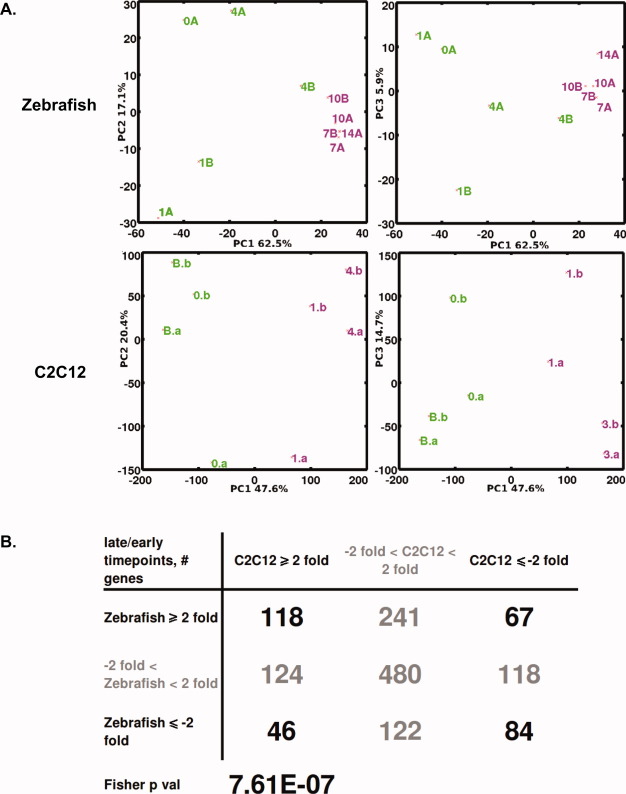
Results: Transcriptome analysis of these cells during myogenic differentiation revealed a strong downregulation of pluripotency genes, while, conversely, showing an upregulation of myogenic signaling and structural genes.

Conclusions: Together these studies provide a simple, yet detailed method for the isolation and culture of myogenic progenitors from adult zebrafish, while further promoting their therapeutic potential for the study of muscle disease and drug screening.


Figures

FIGURE 1
FIGURE 1
Basic protocol for the isolation of zebrafish skeletal muscle myogenic progenitor cells from whole dorsal myotome. Schematic showing the procedure for the isolation of skeletal myogenic progenitors from adult zebrafish dorsal muscle. Following euthanization of the zebrafish with tricaine, the fish are skinned, decapitated, de-finned, and de-gutted. A disassociation step in a mixture of collagenase IV and neutral protease breaks down cellular adhesion, whereas the use of a Ficoll gradient results in the isolation of a mononuclear cell layer. Pre-plating on uncoated plates was followed by an overnight (16-hour) transfer of the myoblast-enriched supernatant to gelatin-coated plates. [Color figure can be viewed in the online issue, which is available at wileyonlinelibrary.com.]
FIGURE 2
FIGURE 2
In vitro differentiation of primary myoblasts isolated from α-actin–RFP adult dorsal muscle. (A–D) Phase contrast of zebrafish myogenic progenitor cells differentiating from day 0 to day 14. (E–H) RFP expression of the α-actin promoter indicates myotube formation and myogenic differentiation. (I–L) Immunofluorescent staining of day 0 α-actin-–RFP myoblasts. Note that very few cells express high levels of the α-actin RFP transgene, as it undergoes higher levels of transcriptional expression during myogenic differentiation. Green fluorescent staining and open arrowheads demarcate myogenic markers (pax3, pax7, myod1, and myogenin). (M) Quantification of 500 DAPI-stained (blue) nuclei of the results from day 0 myoblast immunofluorescent staining in (I)–(L). Immunostaining was performed in triplicate. [Color figure can be viewed in the online issue, which is available at wileyonlinelibrary.com.]
FIGURE 3
FIGURE 3
Microarray analysis of zebrafish myogenic progenitor cell differentiation transcriptome. (A) Principal components analysis (PCA) showing the principal components 1 vs. 2 plot of the zebrafish muscle cell differentiation microarray data of 5960 reproducible genes (shown as colored dots) in time and indicates two large-scale temporal patterns of expression. Genes on the left hemisphere (green) are highly expressed at days 0–1, and decrease over time. Genes on the right hemisphere (magenta) show low expression at days 0–1, and increase over time. The principal components axes are a linear combination of the time-points. (B) The average expression profile of the genes from the two large-scale temporal patterns of expression. (C) Standardized expression for upregulation (red) vs. downregulation (green) of nine differentially regulated myogenic genes. [Color figure can be viewed in the online issue, which is available at wileyonlinelibrary.com.]
FIGURE 4
FIGURE 4
Validation of myogenic differentiation in the zebrafish myogenic progenitor cells by microarray and real-time PCR. (A) Real-time quantitative PCR expression (magenta dashed line) levels of six myogenic differentiation factors (acta1a, cav3, cxcr4a, desma, myog, and pax3a) across time (x-axis; days 0–14) as compared with microarray data (green solid line). The y-axis is logarithm base 2 scale fold change of each time-point relative to day 0, which is the average ΔCT (day 0) minus average ΔCT (day N) value for quantitative PCR data (ddCT), and average RMA signal (day N) minus average RMA signal (day 0) for the microarray data. The quantitative PCR CT values were normalized to the zebrafish housekeeping gene ef1α housekeeping per condition. Note that acta1 and cxcr4 primers were specific to both a and b isoforms present in the zebrafish genome. (B) The table compares the log2 expression fold change of days 0–1 vs. 10–14 of the six myogenic differentiation factors between quantitative PCR and microarray data. [Color figure can be viewed in the online issue, which is available at wileyonlinelibrary.com.]
FIGURE 5
FIGURE 5
Comparison of zebrafish and mouse C2C12 myogenic development. (A) Principal components analysis of samples in transcriptome space showing principal components 1 vs. 2, and 1 vs. 3 plots for the zebrafish and C2C12 (from Gene Expression Omnibus, GSE19968) data show transcriptome scale distinctions between earlier vs. later time-points of muscle development: days 0–1 vs. days 7–10 in zebrafish, and myoblasts vs. differentiated myotubes at day 4 in C2C12. Zebrafish samples are labeled by the time-point following myogenic differentiation (days 0–14). C2C12 samples are labeled as myoblasts (B), and time-points following myogenic differentiation (days 0, 1, and 4). (B) Contingency table of genes ≥2-fold magnitude changed in earlier vs. later time-points of 1400 reproducible genes common to both datasets: fold change of days 10–14 relative to days 0–1 in zebrafish, and fold change of myotubes at day 4 relative to myoblasts in C2C12. [Color figure can be viewed in the online issue, which is available at wileyonlinelibrary.com.]

References

    1. Lieschke GJ, Currie PD. Animal models of human disease: zebrafish swim into view. Nat Rev Genet. 2007;8:353–367. - PubMed
    1. Devoto SH, Melançon E, Eisen JS, Westerfield M. Identification of separate slow and fast muscle precursor cells in vivo, prior to somite formation. Development. 1996;122:3371–3380. - PubMed
    1. Hollway GE, Bryson-Richardson RJ, Berger S, Cole NJ, Hall TE, Currie PD. Whole-somite rotation generates muscle progenitor cell compartments in the developing zebrafish embryo. Dev Cell. 2007;12:207–219. - PubMed
    1. Bassett DI, Currie PD. The zebrafish as a model for muscular dystrophy and congenital myopathy. Hum Mol Genet. 2003;12:R265–R270. - PubMed
    1. Guyon JR, Goswami J, Jun SJ, Thorne M, Howell M, Pusack T, et al. Genetic isolation and characterization of a splicing mutant of zebrafish dystrophin. Hum Mol Genet. 2009;18:202–211. - PMC - PubMed

Publication types