

ZNF703 is a common Luminal B breast cancer oncogene that differentially regulates luminal and basal progenitors in human mammary epithelium
- PMID: 21337521
- PMCID: PMC3395113
- DOI: 10.1002/emmm.201100122
ZNF703 is a common Luminal B breast cancer oncogene that differentially regulates luminal and basal progenitors in human mammary epithelium
Abstract
The telomeric amplicon at 8p12 is common in oestrogen receptor-positive (ER+) breast cancers. Array-CGH and expression analyses of 1172 primary breast tumours revealed that ZNF703 was the single gene within the minimal amplicon and was amplified predominantly in the Luminal B subtype. Amplification was shown to correlate with increased gene and protein expression and was associated with a distinct expression signature and poor clinical outcome. ZNF703 transformed NIH 3T3 fibroblasts, behaving as a classical oncogene, and regulated proliferation in human luminal breast cancer cell lines and immortalized human mammary epithelial cells. Manipulation of ZNF703 expression in the luminal MCF7 cell line modified the effects of TGFβ on proliferation. Overexpression of ZNF703 in normal human breast epithelial cells enhanced the frequency of in vitro colony-forming cells from luminal progenitors. Taken together, these data strongly point to ZNF703 as a novel oncogene in Luminal B breast cancer.
Copyright © 2011 EMBO Molecular Medicine.
Figures
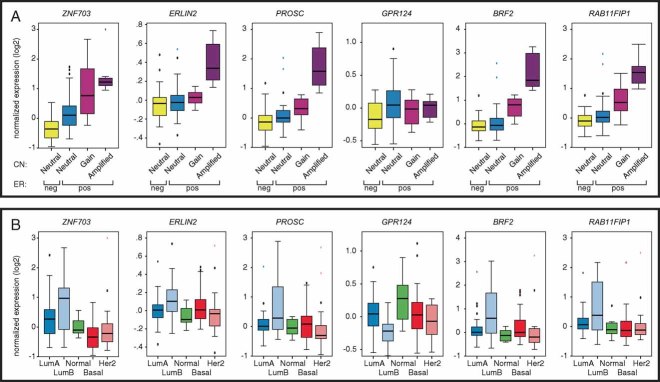
Boxplots of normalized gene expression in 99 tumours (obtained using Illumina arrays) in relation to copy number (CN) state (determined using 28k-arrays).
Boxplots of normalized expression in tumours according to the intrinsic subtype (Luminal A = 43; Luminal B = 22; Normal-like = 13; Her2-enriched = 24; Basal-like = 24), based on the PAM50 classifier.

Graphical representation of the key enzymes and molecules involved in canonical lipid metabolism and detoxification pathways enriched for amongst ZNF703-amplified or overexpressing tumours in the MB-series. Dark red represents molecules whose expression levels are up-regulated greater than 1.5-fold, whereas dark blue represents molecules whose expression levels are down-regulated greater than 1.5-fold. All genes/molecules are significantly differentially expressed with FDR-adjusted p-values < 0.01. Arrows represent biological relationships between molecules and the various shapes represent the functional class of the gene product.
Kaplan–Meier plots (Breast cancer-specific survival, BCSS) and p-values based on a log-rank test are indicated for the comparison of ZNF703 (8p12)-amplified (AMP) versus neutral (NEUT) cases amongst ER-positive tumours.
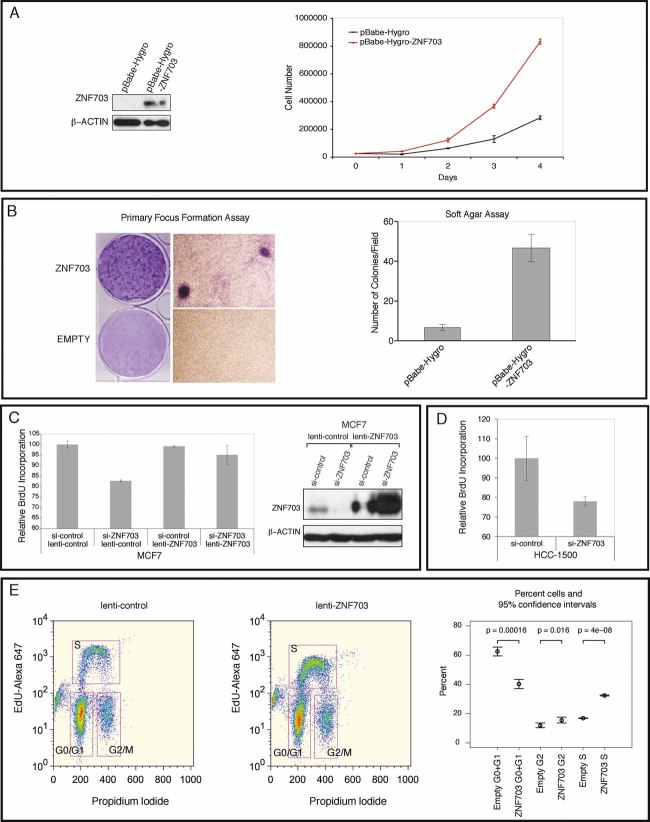
Ectopic ZNF703 expression in NIH 3T3 cells and proliferation. Left panel: Western blot showing ectopic expression of ZNF703 in NIH 3T3 infected cells. Right panel: Proliferation curve of NIH 3T3 fibroblasts ectopically expressing ZNF703. The mean and standard deviation of one representative experiment performed in triplicate is shown.
NIH 3T3 transformation assays. Left panel: Focus formation assay showing foci formed by ectopic expression of ZNF703. Representative pictures of the foci were taken after GIEMSA staining at low and high magnification. Right panel: Bar plot showing counts of colonies in soft agar assay. Colonies were photographed and counted after 4 weeks in 10 random fields (Magnification: ×20). The mean and standard deviation of one representative experiment performed in duplicate is shown.
Proliferation in MCF7 cells with manipulated ZNF703 expression. MCF7 cells were infected either with a lenti-ZNF703 or lenti-control. Lentiviral infected cells were then transfected with scrambled or siRNA oligonucleotides targeting endogenous ZNF703, grown for 48 h and parallel replicate plates (in triplicate) used for RNA extraction, or lysed and cross-linked for Western blot and chromatin IP experiments. Left panel: Bar plot (mean and standard deviation) of BrdU incorporation assay. Right panel: Western blot for ZNF703 and Actin.
Proliferation in HCC1500 cells. Bar plot (mean and standard deviation) of BrdU incorporation assay of HCC1500 cells transfected with either control or ZNF703 siRNA.
Proliferation in HMECs. FACS dot plots and bar chart with results of cell cycle analysis of lenti-control and lenti-ZNF703 infected 184-hTERT immortalized cells.
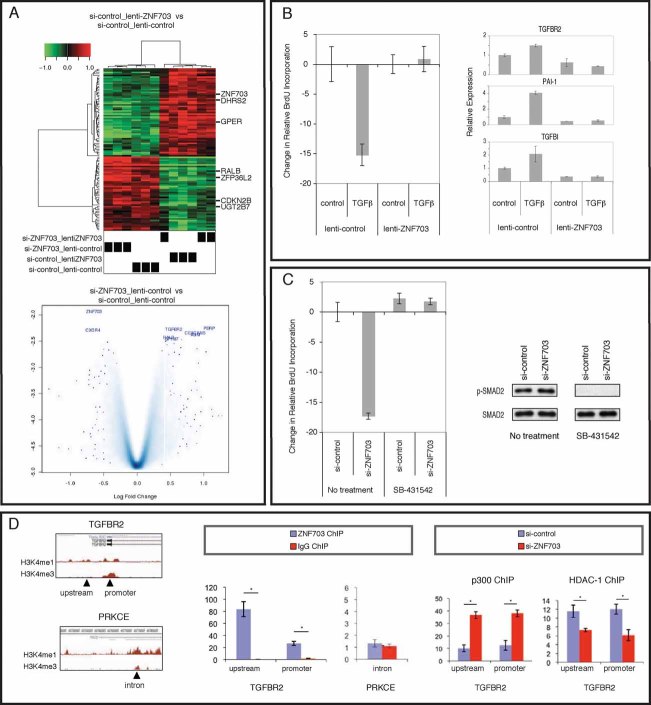
Genes differentially expressed in MCF7 cells with ZNF703 manipulation. Top panel: Clustered heatmap of differentially expressed genes in MCF7 cells overexpressing ZNF703. Bottom panel: Volcano plot showing differentially expressed genes in MCF7 ZNF703 knockdown.
Proliferation of MCF7 cells with ZNF703 overexpression versus control in response to TGFβ. Left panel: Bar plot of BrdU incorporation assay. Right panel: RT-qPCR for TGFβ-pathway genes.
Proliferation of MCF7 cells with ZNF703 knockdown versus control in response to SB-431542. Left panel: Bar plot of BrdU incorporation assay. Right panel: Western blot for pSMAD2 and total SMAD2.
TGFBR2 chromatin immuno-precipitation (ChIP). Left panel: Schematic representation of the genomic regions around the TGFBR2 and PRKCE genes and relative location of primer sequences used for PCR of immunoprecipitated chromatin. Middle panel: Fold enrichment measured by real-time PCR of the regulatory regions described above in ZNF703 versus IgG control ChIP from untransfected MCF7 cells. The data are the average (±SD) of three individual replicates. Right panel: Fold enrichment measured by real-time PCR in ChIP for p300 and HDAC-1 from si-control or si-ZNF703 transfected MCF7 cells. Data show the average of three independent replicates ±Std Dev. * denotes p < 0.05.
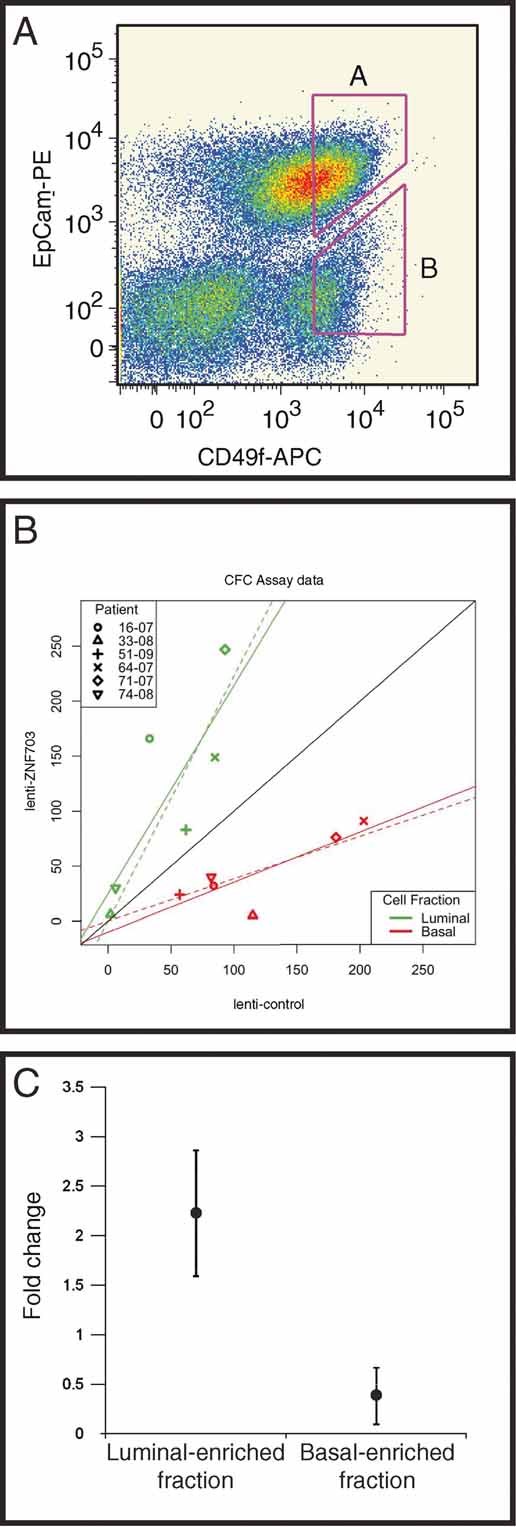
FACS plot of one of the primary mammary epithelium single cell suspensions showing the gating used to isolate the Luminal-enriched fraction (A) and Basal-enriched fraction (B).
CFC assay data bivariate plot. X-axis shows the number of colonies counted under the control condition (empty vector). Y-axis shows the number of colonies counted under the experimental condition (vector containing ZNF703 construct). Black reference line has slope = 1.0 and intercept = 0. Solid lines show full linear model fit results. Dashed lines show linear model fits with intercept constrained to be zero.
CFC assay results with chart showing colony count fold change with ZNF703 overexpression in Luminal-enriched (A) or Basal-enriched (B) sorted fractions relative to the empty vector control condition. Vertical bars represent 95% confidence intervals (n = 6).
Comment in
-
Divide and conquer: the genetic basis of molecular subclassification of breast cancer.EMBO Mol Med. 2011 Apr;3(4):183-5. doi: 10.1002/emmm.201100128. Epub 2011 Mar 10. EMBO Mol Med. 2011. PMID: 21394915 Free PMC article.
References
-
- Adelaide J, Finetti P, Bekhouche I, Repellini L, Geneix J, Sircoulomb F, Charafe-Jauffret E, Cervera N, Desplans J, Parzy D, et al. Integrated profiling of basal and luminal breast cancers. Cancer Res. 2007;67:11565–11575. - PubMed
-
- Chin K, DeVries S, Fridlyand J, Spellman PT, Roydasgupta R, Kuo WL, Lapuk A, Neve RM, Qian Z, Ryder T, et al. Genomic and transcriptional aberrations linked to breast cancer pathophysiologies. Cancer Cell. 2006;10:529–541. - PubMed
MeSH terms
Substances
Grants and funding
LinkOut - more resources
Full Text Sources
Other Literature Sources
Medical
Molecular Biology Databases
Research Materials
