

doi: 10.1021/bi2000824.
Epub 2011 Feb 21.
Residue-specific fluorescent probes of α-synuclein: detection of early events at the N- and C-termini during fibril assembly
Affiliations
- PMID: 21338068
- PMCID: PMC3074234
- DOI: 10.1021/bi2000824
Item in Clipboard
Residue-specific fluorescent probes of α-synuclein: detection of early events at the N- and C-termini during fibril assembly
Biochemistry.
.
Abstract
In the Parkinson's disease-associated state, α-synuclein undergoes large conformational changes, forming ordered, β-sheet-containing fibrils. To unravel the role of specific residues during the fibril assembly process, we prepared single-Cys mutants in the disordered (G7C and Y136C) and proximal (V26C and L100C) fibril core sites and derivatized them with environmentally sensitive dansyl (Dns) fluorophores. Dns fluorescence exhibits residue specificity in spectroscopic properties as well as kinetic behavior; early kinetic events were revealed by probes located at positions 7 and 136 compared to those at positions 26 and 100.
Figures
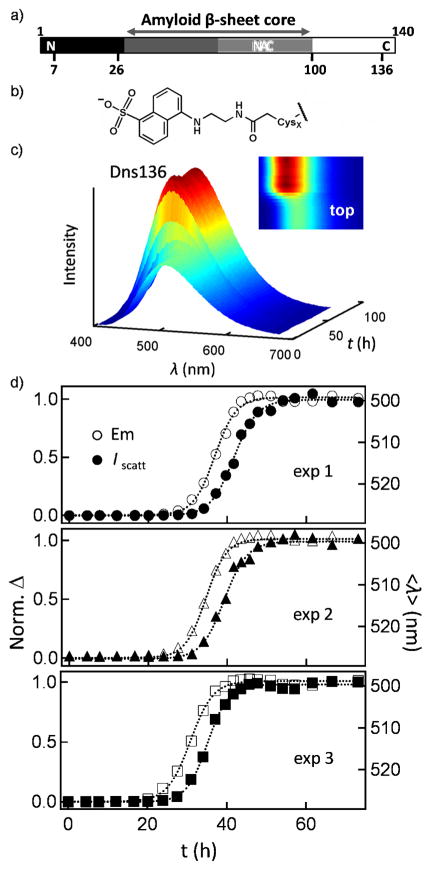
(a) Primary sequence of α-syn highlighting the amyloid β-sheet core (residues 30-100), non-amyloid β component (NAC) region (residues 61-95), and Cys-labeling sites (G7C, V26C, L100C, Y136C) used in this study. (b) Structure of Dns fluorophore. (c) Representative fluorescence spectra of Dns136 (1.5 μM) during α-syn aggregation (100 μM in 25 mM NaPi, 100 mM NaCl, pH 7, 37 °C, shaking at 600 rpm, t = 0 – 75 h). Inset shows the Dns136 emission intensity surface. Dns emission intensity is in arbitrary units (blue-to-red) normalized to the highest intensity. Data for other sites can be found in Figure S3. (d) Aggregation kinetics for three independent measurements monitored simultaneously by Dns136 emission (Em, open symbols) and light scattering (Iscatt, closed symbols); typical lag phase ~ 20 – 30 h. Data for other sites can be found in Figure S7. Left axes represent normalized change (Norm. Δ) for Iscatt and Em and right axes represent absolute mean wavelength changes (<λ>).
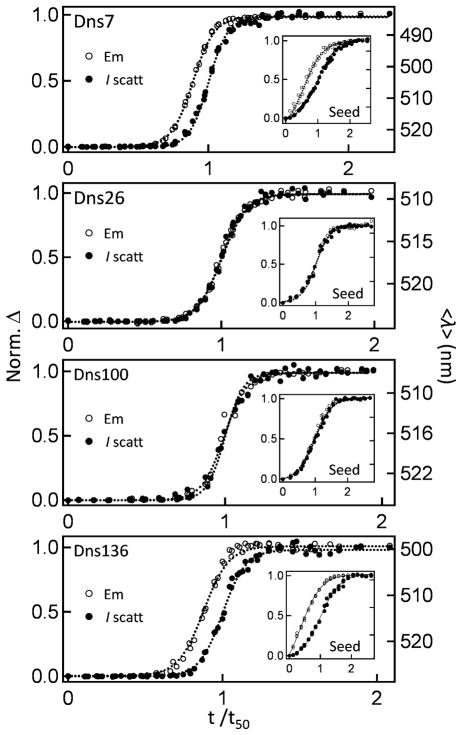
Residue-specific probes of α-syn aggregation in the absence and presence (Inset) of preformed seeds (3%). Aggregation kinetics monitored simultaneously by Dns7, 26, 100, and 136 emission (Em, open circles) and light scattering (Iscatt, closed circles) for three independent measurements. To compare the different sites, we have normalized the time axes with Iscatt midpoint transition times (time that takes to reach 50% of maximum signal, t50) extracted from fits of respective Iscatt data to sigmoidal functions. Left axes represent normalized change (Norm. Δ) and right axes represent absolute mean wavelength change (<λ>).
References
Publication types
MeSH terms
Substances
Grants and funding
LinkOut - more resources
Full Text Sources
