Review
. 2011 Feb 22;5(2):693-729.
doi: 10.1021/nn103298x.

Electrons, photons, and force: quantitative single-molecule measurements from physics to biology

Affiliations
Free PMC article
Review

Electrons, photons, and force: quantitative single-molecule measurements from physics to biology

Shelley A Claridge et al. ACS Nano. .
Free PMC article

Abstract

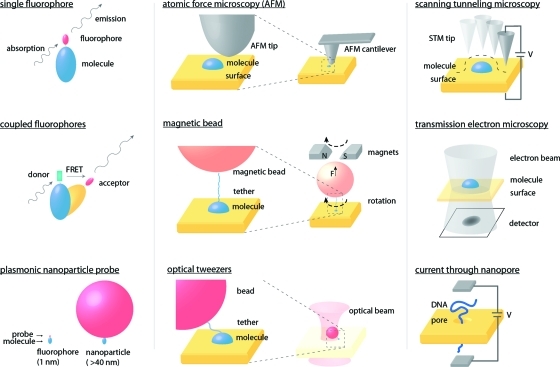
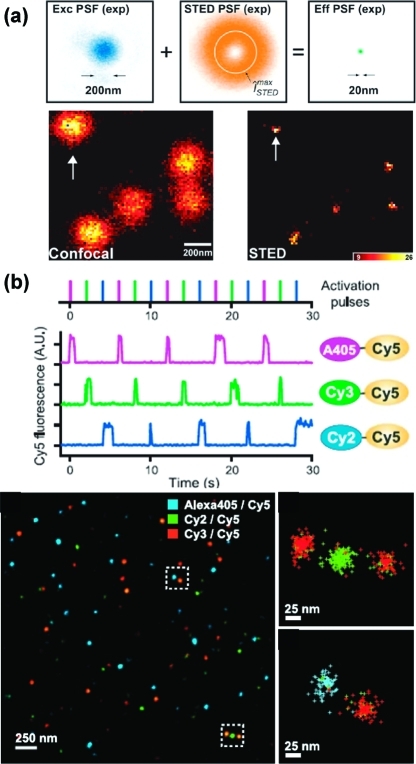
Single-molecule measurement techniques have illuminated unprecedented details of chemical behavior, including observations of the motion of a single molecule on a surface, and even the vibration of a single bond within a molecule. Such measurements are critical to our understanding of entities ranging from single atoms to the most complex protein assemblies. We provide an overview of the strikingly diverse classes of measurements that can be used to quantify single-molecule properties, including those of single macromolecules and single molecular assemblies, and discuss the quantitative insights they provide. Examples are drawn from across the single-molecule literature, ranging from ultrahigh vacuum scanning tunneling microscopy studies of adsorbate diffusion on surfaces to fluorescence studies of protein conformational changes in solution.


Figures

Figure 1
Figure 1
Quantitative analysis of single-molecule measurements based on photons, force, and electrons. Photonic measurements (left) are usually based on one or more fluorescent labels (either small molecules or fluorescent proteins) or a larger nanoparticle label. Force-based measurements (center) typically use a macroscopic cantilever or a micrometer-scale bead to apply forces from piconewtons to nanonewtons. Electron-based methods (right) can involve electron conductance, tunneling, or scattering.
Figure 2
Figure 2
Overview of electron-based single-molecule measurements. Electrons can be used to perform label-free structural measurements of single atoms and molecules, including molecular lattices and their defects, heterogeneous structures, and motion including diffusion and switching. Single-molecule spectroscopy can also be performed using a scanning tunneling microscope by varying either bias or tip height or by applying a magnetic field to polarize spins.
Figure 3
Figure 3
Electron-based measurements can be used to quantify both regular lattice structures and defects. (a,b) STM is used to quantify packing density and structure of two different halogenated phenols on a Cu{111} surface. Both regular structure and defects are evident in both frames. (c) TEM image and Fourier transform of a nanocrystal superlattice composed of PbS and Pd particles. Again, direct imaging allows defects to be observed in addition to lattice structure. (d) TEM image of a one-dimensional lattice of endohedral lanthanide fullerenes in a single-walled carbon nanotube. Inset shows positions of individual lanthanide atoms within fullerenes. Note that while TEM typically measures longer length scales than STM (observe difference in scale bars between (a−b) and (c)), it is also possible to measure shorter length scales similar to STM (note similar scale bars in (a−b) and (d)). Adapted from refs (58), (59), and (66).
Figure 4
Figure 4
Scanning tunneling microscopy used to measure heterogeneity in self-assembled monolayers of alkanethiols on Au{111}. Addition of thiols to an atomically flat gold surface causes reconstruction of the gold surface under ordered molecular domains and creates irregular one-atom deep pits where thiols have removed gold atoms. The etch pits act to trap tilt domain defects (lines running between pits in (b)). Adapted from ref (76).
Figure 5
Figure 5
Electron-based measurements in real space can be used to quantify heterogeneous structure at the single-molecule scale. (a) STM image of Br adatom islands on Cu{111}. (b) Histogram of inter-island distances exhibits peaks at multiples of half the Fermi wavevector; black dotted line shows the expected distribution in the absence of interisland interactions. (c) Automated analysis of TEM images identifies gold nanoparticle and gold/quantum dot groupings on single-molecule DNA scaffolds; DNA scaffolds are not visible in TEM images due to the low atomic number of organic elements. Adapted from refs (91) and (98)−(100).
Figure 6
Figure 6
Measuring single-molecule motion on surfaces using STM. (a) Diffusion of aromatic acene on Cu{111} and Arrhenius plot of diffusion rate vsT. (b) STM images of single acene molecules bound to one and two CO2 molecules, and Arrhenius plot showing reduced diffusion rate of acenes with CO2 bound. (c) Automated analysis of diffusion of benzene on Au{111} based on image cross-correlation. Motion events are binned based on the number of nearest-neighbor benzenes to calculate association energies based on substrate-mediated interactions. Adapted from refs (104) and (109)−(111).
Figure 7
Figure 7
(a) Sequence of liquid TEM images of the growth and coalescence of single platinum nanocrystals. (b) Tracking the number of nanoparticles over time shows an initial growth phase followed by coalescence. Adapted from ref (118).
Figure 8
Figure 8
STM imaging of single-molecule switching and diffusion on surfaces. (a) Single oligo(phenylene ethynylene) molecules near step edges in a Au{111} surface exhibit both ON/OFF conductance switching and migration up and down the monatomic step edges. (b) Sequential images of the same molecule show three populations of apparent heights analyzed over time and in histogram form (c). Adapted from ref (81).
Figure 9
Figure 9
Standard STM geometry used to quantify conductance at many points within a single-molecule switch. (a) Changes in tunneling current observed at a single point due to hydrogen tautomerization in naphthalocyanine on a NaCl bilayer on Cu(111). (b) Schematic of tautomerization. (c) Spatial mapping of switching rate, with each pixel representing approximately 100 switching events. Adapted from ref (129).
Figure 10
Figure 10
Molecular rotation can be quantified by STM. At temperatures above 15 K, dibutyl sulfide rotates between three equivalent orientations (top right) on a Au{111} surface, appearing as a hexagon (top center). When the STM tip is positioned off-center on the molecule (top right, black dot), changes in the tunneling current can be used to track changes between the three orientations (center). Many such measurements can be combined to calculate rotational energy barriers and pre-exponential factors (bottom). Adapted from ref (143).
Figure 11
Figure 11
Electronic break junction can be used to quantify the conductance of single molecules. As a gold contact is slowly broken, quantized decreases in conductance are observed, first corresponding to changes in the geometry of the gold contact (a,b), then a set of smaller quantized peaks (c,d) resulting from one, two, or three conductive molecules (here dipyridine) bridging the junction. At slightly larger distances, the junction ceases to exhibit conductance (e,f). Adapted from ref (164).
Figure 12
Figure 12
Inelastic electron tunneling spectroscopy (IETS) measures vibrational energy levels in single molecules. Single-molecule tunneling spectroscopy at low temperatures allows identification of Br and fluorophenyl (F−Ph) intermediates in an Ullman coupling reaction on a Cu{111} surface and measurement of the C−H out-of-plane bending mode in the fluorophenyl group. Adapted from ref (180).
Figure 13
Figure 13
Simultaneously acquired (a) topographic and (b) polarizability STM images of a dodecanethiolate SAM with inserted nitro-functionalized OPE molecular switches. (c) Sequential images (30 s between frames) of individual switch molecules, showing instabilities in microwave polarizability image prior to visible switching in topographic image, and microwave peaks evident after topographic peak disappears. Adapted from ref (187).
Figure 14
Figure 14
Overview of photonic quantification of single-molecule properties. Photonic measurements are typically based on observation of a fluorophore or larger optical probe covalently linked to the target molecule. Longer length scales enable fluorophore locations to be correlated with larger structures such as cells. Short distances (1−100 nm) can also be probed by measuring coupling between two optical labels on a single molecule; such experiments are used for observing conformational changes in proteins and DNA. Orientation changes have been probed using both fluorescence polarization measurements and larger probes. Fluorophores can also be chosen to be sensitive to pH, ion concentrations, or other factors, providing a readout of the local environment around a single molecule.
Figure 15
Figure 15
Diffraction-limited single-molecule imaging. Directed motion of motility protein MreB labeled with YFP is tracked in live cells. (a) Three YFP-labeled MreB proteins (arrows) in a bacterial cell (white outline). (b) Smoothed image. (c) Time-lapse trajectory of center fluorophore from (a). (d) Top and bottom fluorophores from (a) are stationary over the period of measurement and appear as bright spots in a time-averaged image. (e) Distribution of diffusion coefficients for MreB proteins shows the impact of adding A22, a small-molecule inhibitor of MreB function. Adapted from ref (213).
Figure 16
Figure 16
Examples of subdiffraction-limited single-molecule optical imaging. (a) Stimulated emission depletion (STED) imaging first excites fluorophores in a diffraction-limited spot (blue), then depletes the excited states in a ring (orange) around the edge of the spot, yielding an effective point spread function (PSF) on the order of 20 nm. The difference between the 200 nm diffraction-limited spot size and 20 nm effective PSF is shown for Synaptotagmin I molecules on endosomes. (b) Stochastic optical reconstruction microscopy (STORM) photoactivates small numbers of probes at a time, allowing each probe to be localized to a spot on the order of 20 nm. Adapted from refs (215) and (225).
Figure 17
Figure 17
FRET between two fluorophores on a single molecule can act as a ruler for the distance between the fluorophores. (a) Emission intensities vs time for target molecules irradiated at the donor wavelength: in-range donor−acceptor, out-of-range donor−acceptor, donor-only, and acceptor-only. (b) Emission intensities for same molecules irradiated at acceptor wavelength. (c) Switching between irradiation at donor and acceptor wavelengths at short time scales allows binning of four populations of molecules in a two-dimensional histogram based on FRET efficiency (E) and donor−acceptor stoichiometry (S), where S(D-only) = 1, S(A-only) = 0, S(D−A) = 0.5. The three histograms at the right show the shift in the D−A peak of double-labeled DNA molecules, as the distance between the fluorophores is increased. Adapted from ref (234).
Figure 18
Figure 18
(a) Plasmon coupling between individual pairs of Au and Ag nanoparticles causes a spectral shift visible by dark-field microscopy. (b) Plasmon coupling can be used as a ruler for distance changes above 10 nm; here, it is used to measure the bending and cleavage of single DNA molecules by the enzyme EcoRV. (c) Intensity trace vs time shows the initial straight configuration, the high-intensity bent state, and the low-intensity cleaved state. (d) Bending kinetics are measured by pooling data from many events. Adapted from refs (229) and (230).
Figure 19
Figure 19
Fluorescence polarization measurements of kinesin rocking motion when bound to a microtubule. (b) Microtubules decorated with many fluorescently labeled kinesin fragments exhibit fluorescence anisotropy when kinesin is bound to AMP, but not when bound to ADP. (c) Single-molecule measurements show fluorescence anisotropy of AMP-bound kinesin taken at four different polarization angles. These measurements can be translated into immobility factors, showing that AMP-bound kinesin molecules are held rigid, while ADP-bound kinesin has high rotational mobility. Adapted from ref (243).
Figure 20
Figure 20
(a) Large optical probe measures rotation of kinesin proteins bound to microtubules. A 1.3 μm polystyrene bead bound to two smaller fluorescent beads is attached to the kinesin protein via a linker. Optical microscopy can distinguish changes in orientation of the two fluorescent beads. (b) Tracking angular rotation over time shows differences between two kinesin variants. (c) Variance in each single-molecule trace can be compiled to assess population behavior; the K351 variant exhibits a linear increase in variance, while the K448 variance can be fit asymptotically. Adapted from ref (247).
Figure 21
Figure 21
Force-based measurements of single molecules. In atomic force microscopy (AFM), a scanning probe can be used to image surface topography, motion of single molecules, and surface functionality. In another class of measurements, the force probe is instead bound to the target molecule; in such measurements, both molecular motion and the associated forces can be quantified.
Figure 22
Figure 22
(a) Ball-and-stick model of pentacene molecule. (b) Frequency-shift AFM measurement of pentacene on Cu{111} with a single CO molecule adsorbed to the tip. Adapted from ref (28).
Figure 23
Figure 23
(a) Schematic for simultaneous topographic and recognition imaging using TREC-AFM. (b) Topographic image of avidin electrostatically adsorbed to mica and imaged with a biotin-functionalized tip. (c) Simultaneously acquired recognition image, with areas of low intensity corresponding to locations of avidin molecules (examples circled). Adapted from ref (278).
Figure 24
Figure 24
(a) Kinesin motor proteins have two heads that bind to a microtubule repeatedly as the kinesin walks down the microtubule. Different walking mechanisms are possible, resulting in either all 8 nm steps or alternating 7 and 9 nm steps as shown. (b,c) Measuring a large number of individual steps using an optical force clamp makes it possible to distinguish that kinesin takes all 8 nm steps rather than alternating 7 and 9 nm steps. Adapted from refs (281) and (285).
Figure 25
Figure 25
(a,b) DNA passing through an α-hemolysin nanopore. A self-complementary hairpin in the DNA prevents it from passing completely through the pore until sufficient voltage is applied. (c,d) Current readout showing ionic current drop when DNA blocks nanopore, and voltage (force) required to unzip the hairpin and complete the transit. Adapted from ref (295).
Figure 26
Figure 26
(a) AFM pulling on single titin Ig proteins. (b) Each peak in the force−distance curve corresponds to unfolding of a single titin repeat unit. Adapted from ref (15).
Figure 27
Figure 27
Reversible unfolding of single RNA hairpins pulled between two light-scattering 2 μm beads. (a) RNA hairpins are attached to beads through 500 bp hybridized RNA/DNA handles. (b) Force vs extension curves show differences in extension behavior for RNA/DNA handles with (black) and without (red) a hairpin loop sequence. (c) Average unfolding force calculated based on 36 sequential unfolding/refolding events in a single molecule. (d) Length vs time traces at constant forces show hopping between folded and unfolded states at forces from 14.0−14.6 pN. (e) Calculation of unfolding equilibrium constant based on applied force. Adapted from ref (301).
Figure 28
Figure 28
Both magnetic and flow forces are used to measure force vs extension curves for single DNA molecules. DNA tethered at one end to a glass slide and at the other to a 3 μm magnetic bead is subjected to both flowing solvent and a magnetic field in another direction to allow more precise force calibration. Adapted from ref (5).
Figure 29
Figure 29
(a) Magnetic bead winding measures force vs extension curves for single 17 μm DNA molecules based on fraction of supercoiling (σ). (b) Positively supercoiled DNA exhibits a transition to slower extension at forces greater than 3 pN, whereas (c) a similar transition occurs for negatively supercoiled DNA at 0.45 pN. Adapted from ref (6).
Figure 30
Figure 30
(a) Single-molecule detection based on spin using magnetic resonance force microscopy. (b) Cross section of a single tobacco mosaic virus. (c) Image of tobacco mosaic virus. Adapted from ref (313).

Similar articles

Cited by

References

    1. Müller E. W. Das Feldionenmikroskop. Z. Angew. Phys. 1951, 131, 136–142.
    1. Melmed A. J.; Müller E. W. Study of Molecular Patterns in the Field Emission Microscope. J. Chem. Phys. 1958, 29, 1037–1041.
    1. Moerner W. E.; Kador L. Optical-Detection and Spectroscopy of Single Molecules in a Solid. Phys. Rev. Lett. 1989, 62, 2535–2538. - PubMed
    1. Binnig G.; Rohrer H. Scanning Tunneling Microscopy. Helv. Phys. Acta 1982, 55, 726–735.
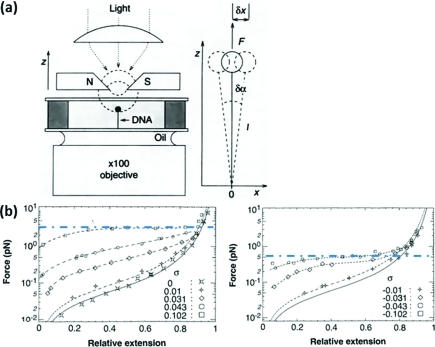
    1. Smith S. B.; Finzi L.; Bustamante C. Direct Mechanical Measurements of the Elasticity of Single DNA-Molecules by Using Magnetic Beads. Science 1992, 258, 1122–1126. - PubMed

Publication types