

doi: 10.1186/gb-2011-12-2-r18.
Epub 2011 Feb 21.
Analyzing and minimizing PCR amplification bias in Illumina sequencing libraries
Affiliations
- PMID: 21338519
- PMCID: PMC3188800
- DOI: 10.1186/gb-2011-12-2-r18
Item in Clipboard
Analyzing and minimizing PCR amplification bias in Illumina sequencing libraries
Genome Biol.
2011.
Abstract
Despite the ever-increasing output of Illumina sequencing data, loci with extreme base compositions are often under-represented or absent. To evaluate sources of base-composition bias, we traced genomic sequences ranging from 6% to 90% GC through the process by quantitative PCR. We identified PCR during library preparation as a principal source of bias and optimized the conditions. Our improved protocol significantly reduces amplification bias and minimizes the previously severe effects of PCR instrument and temperature ramp rate.
Figures
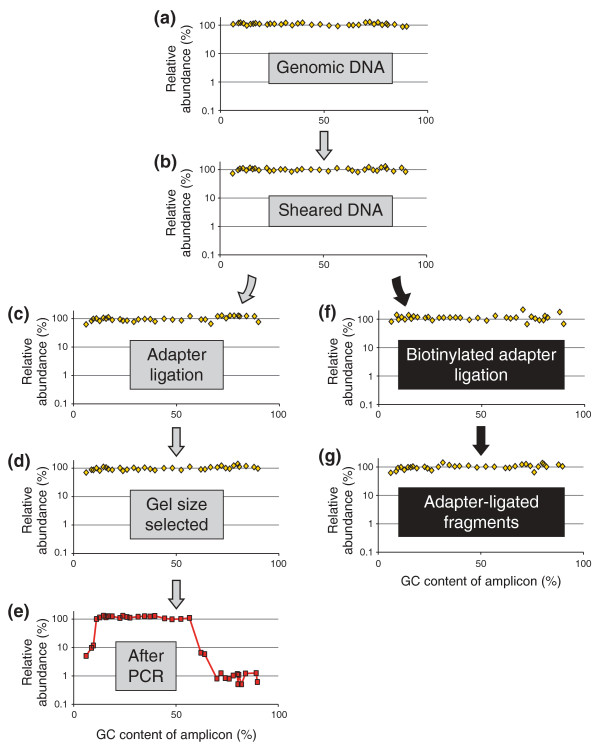
Tracing a diverse panel of loci through the Illumina library preparation. (a-e) At five steps in the standard protocol aliquots were removed and analyzed for base-composition bias by qPCR. (f,g) To isolate and analyze the ligation-competent population of DNA fragments, a separate ligation reaction with biotinylated adapters was performed followed by streptavidin capture of fragments carrying at least one adapter. The quantity of each amplicon in a given sample was divided by the mean quantity of the two amplicons closest to 50% GC. The resulting relative abundances of amplicons were plotted on a log10 scale over their respective GC contents.
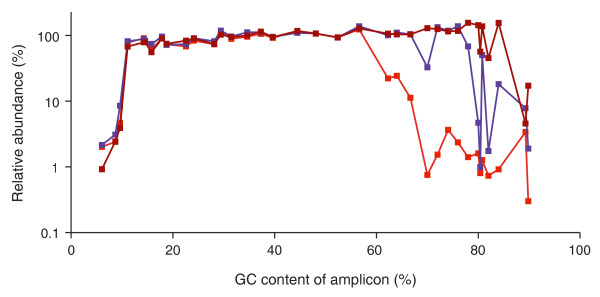
Effect of temperature ramp rates. The standard PCR protocol with Phusion HF DNA polymerase and short initial (30 s) and in-cycle (10 s) denaturation times was performed on three different thermocyclers at their respective default temperature ramp settings. Heating and cooling rates were 6°C/s and 4.5°C/s on thermocycler 1 (bright red line), 4°C/s and 3°C/s on thermocycler 2 (purple line) and 2.2°C/s and 2.2°C/s on thermocycler 3 (dark red line).
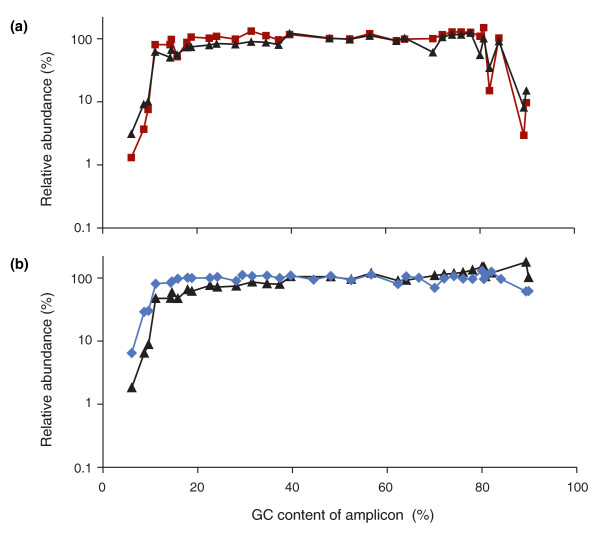
Optimizing the PCR conditions. (a) Neither extending the denaturation times (dark red squares) nor adding 2M betaine (black triangles) is sufficient to recover extremely GC-rich DNA fragments by PCR with Phusion HF. (b) Combining long denaturation and 2M betaine is effective for the high-GC fraction (black triangles) but the profile is not as even over the entire GC spectrum as after PCR with AccuPrime Taq HiFi (blue diamonds) using extended denaturation times and a lower temperature (65°C) for primer annealing and extension.
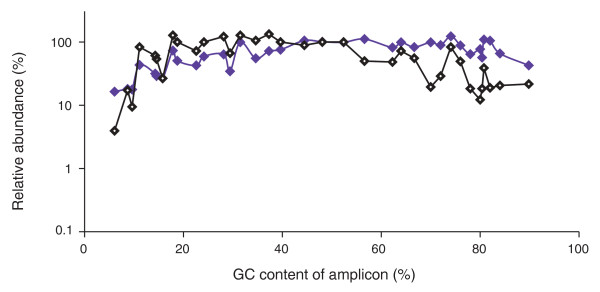
Comparing input library and output sequencing data. Shown is the relative abundance of loci in the library as determined by qPCR (purple) and the relative abundance of Illumina sequencing reads covering these loci in one lane of Hi-Seq data (black). Both data sets were normalized to the average of the two loci closest to 50% GC.
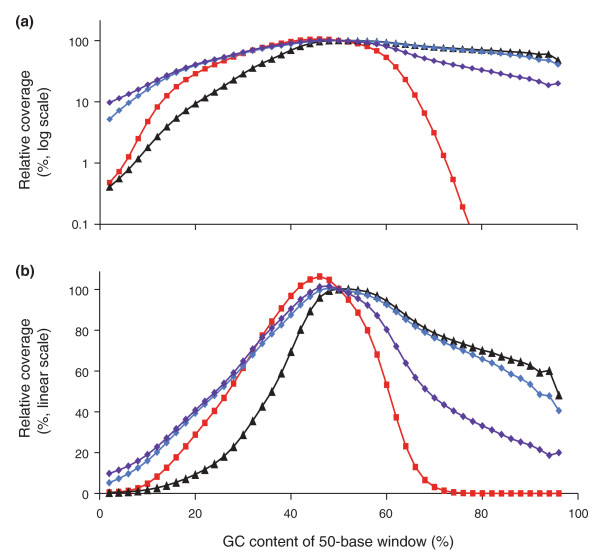
'PER' genome-wide base composition bias curves. (a,b) Shown is the GC bias in Illumina reads from a 400-bp fragment library amplified using the standard PCR protocol (Phusion HF, short denaturation) on a fast-ramping thermocycler (red squares), Phusion HF with long denaturation and 2M betaine (black triangles), AccuPrime Taq HiFi with long denaturation and primer extension at 65°C (blue diamonds) or 60°C (purple diamonds). To calculate the observed to expected (unbiased) read coverage, the number of reads aligning to 50-bp windows at a given %GC was divided by the number of 50-bp windows that fall in this %GC category. This value was then normalized relative to the average value from 48% through 52% GC and plotted on a log10 scale (a) or linear scale (b).
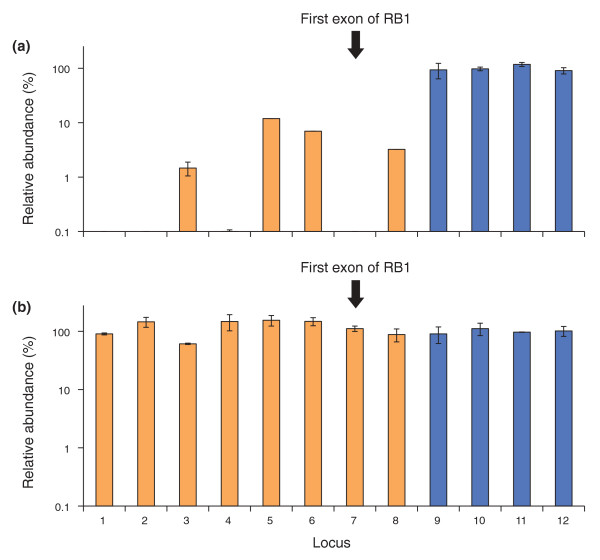
Optimized PCR conditions rescue GC-rich promoter regions in the human genome. (a,b) A 180-bp fragment library of human DNA was amplified using (a) standard conditions (Phusion HF, short denaturation) or (b) optimized conditions (AccuPrime HiFi, long denaturation, extension at 65°C) on the fast-ramping thermocycler 1. The amplified libraries were analyzed by qPCR. Orange bars indicate the quantity of eight GC-rich loci near gene promoters relative to the mean quantity of four size-matched control loci (blue bars; mean set to 100% in each graph). Error bars represent the range of two measurements averaged to calculate the quantity of each locus. Locus 7 is the first protein-coding exon of the tumor suppressor gene RB1.
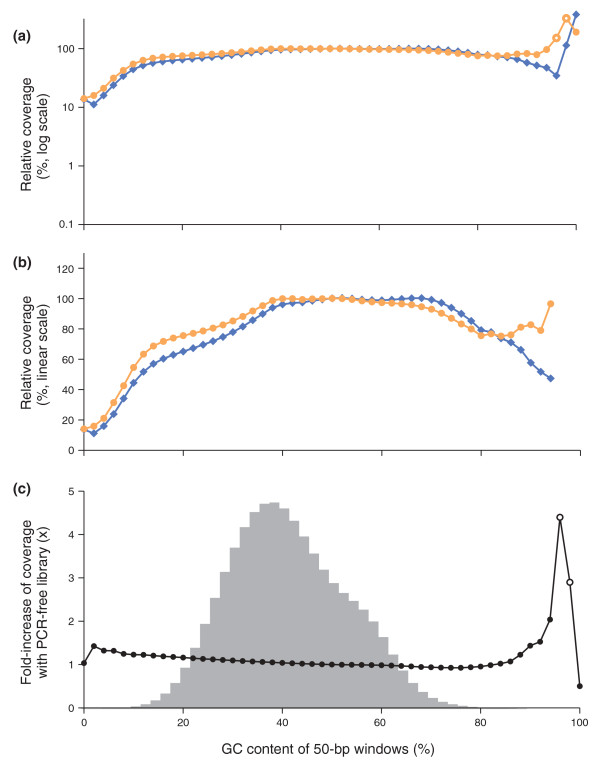
Sequencing bias with PCR-amplified and PCR-free libraries. (a,b) Shown is the mean normalized coverage of 50-bp windows in the human genome having the GC-content indicated on the x-axis for a PCR-free (orange dots) and a PCR-amplified (blue diamonds) Illumina sequencing library. Both fragment libraries had approximately 180-bp inserts. The PCR amplification was performed with AccuPrime Taq HiFi (long denat., primer extension at 65°C). The coverage was plotted on a log10 (a) and a linear scale (b). The data points at extremely high GC, where the reads from the PCR-free library had a mean base quality of less than Q20 (open symbols), were omitted in the middle panel (b). (c) The ratios of the two curves in (a,b), that is, the fold-increase in mean coverage by sequencing a PCR-free library instead of a PCR-amplified library. The shaded histogram is the %GC distribution of 50-bp windows in the human genome. More than 99.9% of all 50-bp windows in the genome contain 8% to 88% GC and received a less than 1.25-fold increase in coverage. Less than 0.01% of all 50-bp windows contain 90% or more GC. The open circles at 96% and 98% GC denote data for which the mean base quality of the reads from the PCR-free library was below Q20.
References
-
- Bentley DR, Balasubramanian S, Swerdlow HP, Smith GP, Milton J, Brown CG, Hall KP, Evers DJ, Barnes CL, Bignell HR, Boutell JM, Bryant J, Carter RJ, Keira Cheetham R, Cox AJ, Ellis DJ, Flatbush MR, Gormley NA, Humphray SJ, Irving LJ, Karbelashvili MS, Kirk SM, Li H, Liu X, Maisinger KS, Murray LJ, Obradovic B, Ost T, Parkinson ML, Pratt MR. et al. Accurate whole human genome sequencing using reversible terminator chemistry. Nature. 2008;456:53–59. doi: 10.1038/nature07517. - DOI - PMC - PubMed
-
- Margulies M, Egholm M, Altman WE, Attiya S, Bader JS, Bemben LA, Berka J, Braverman MS, Chen YJ, Chen Z, Dewell SB, Du L, Fierro JM, Gomes XV, Godwin BC, He W, Helgesen S, Ho CH, Irzyk GP, Jando SC, Alenquer ML, Jarvie TP, Jirage KB, Kim JB, Knight JR, Lanza JR, Leamon JH, Lefkowitz SM, Lei M, Li J. et al. Genome sequencing in microfabricated high-density picolitre reactors. Nature. 2005;437:376–380. - PMC - PubMed
-
- McKernan KJ, Peckham HE, Costa GL, McLaughlin SF, Fu Y, Tsung EF, Clouser CR, Duncan C, Ichikawa JK, Lee CC, Zhang Z, Ranade SS, Dimalanta ET, Hyland FC, Sokolsky TD, Zhang L, Sheridan A, Fu H, Hendrickson CL, Li B, Kotler L, Stuart JR, Malek JA, Manning JM, Antipova AA, Perez DS, Moore MP, Hayashibara KC, Lyons MR, Beaudoin RE. et al. Sequence and structural variation in a human genome uncovered by short-read, massively parallel ligation sequencing using two-base encoding. Genome Res. 2009;19:1527–1541. doi: 10.1101/gr.091868.109. - DOI - PMC - PubMed
-
- Hillier LW, Marth GT, Quinlan AR, Dooling D, Fewell G, Barnett D, Fox P, Glasscock JI, Hickenbotham M, Huang W, Magrini VJ, Richt RJ, Sander SN, Stewart DA, Stromberg M, Tsung EF, Wylie T, Schedl T, Wilson RK, Mardis ER. Whole-genome sequencing and variant discovery in C. elegans. Nat Methods. 2008;5:183–188. doi: 10.1038/nmeth.1179. - DOI - PubMed
Publication types
MeSH terms
Grants and funding
LinkOut - more resources
Full Text Sources
Other Literature Sources
Research Materials
Miscellaneous
