. 2011 Jun 1;56(3):1286-92.
doi: 10.1016/j.neuroimage.2011.02.039. Epub 2011 Feb 19.

Quantitative in vivo measurement of early axonal transport deficits in a triple transgenic mouse model of Alzheimer's disease using manganese-enhanced MRI

Affiliations

Quantitative in vivo measurement of early axonal transport deficits in a triple transgenic mouse model of Alzheimer's disease using manganese-enhanced MRI

Jieun Kim et al. Neuroimage. .

Abstract

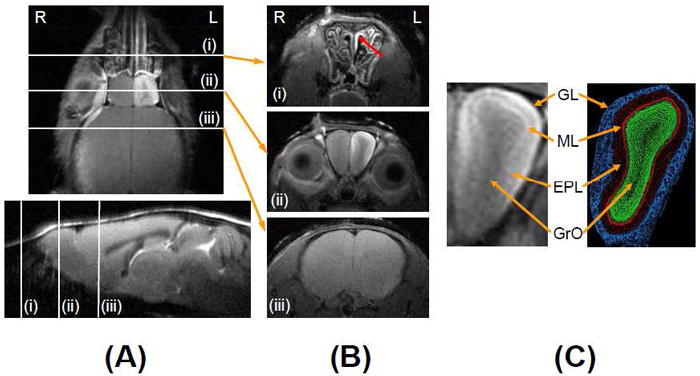
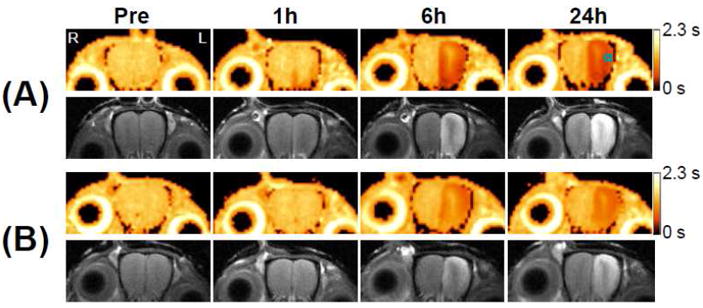
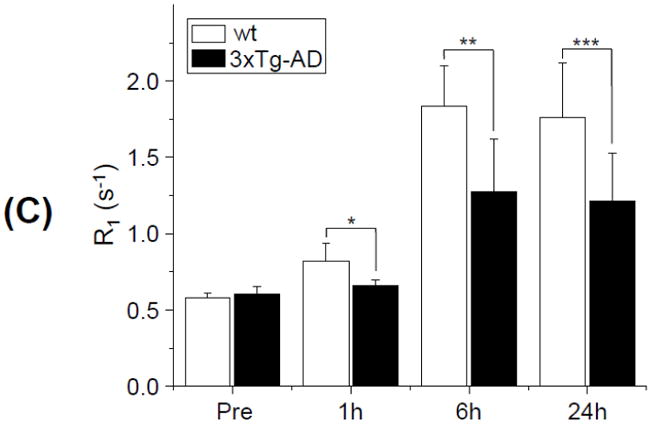
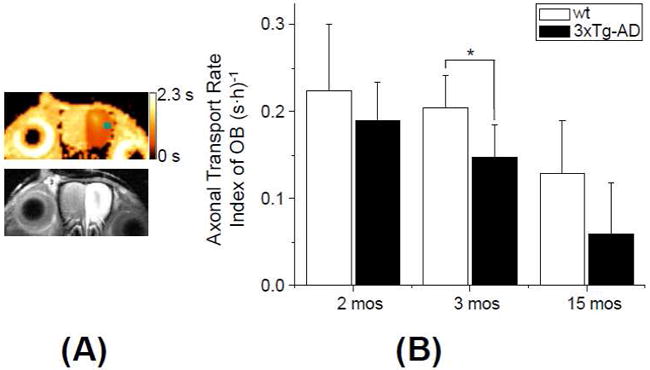
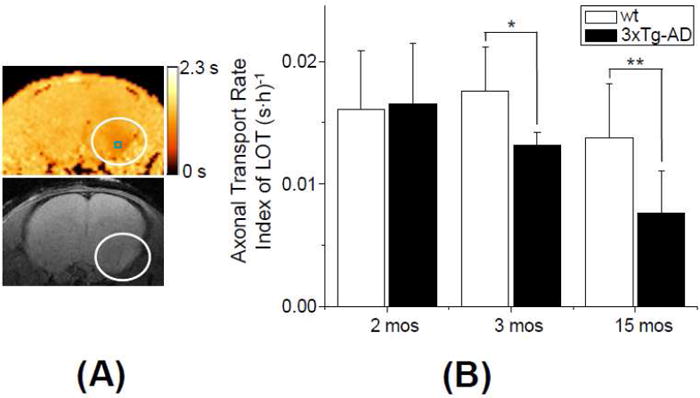
Impaired axonal transport has been linked to the pathogenic processes of Alzheimer's disease (AD) in which axonal swelling and degeneration are prevalent. The development of non-invasive neuroimaging methods to quantitatively assess in vivo axonal transport deficits would be enormously valuable to visualize early, yet subtle, changes in the AD brain, to monitor the disease progression and to quantify the effect of drug intervention. A triple transgenic mouse model of AD closely resembles human AD neuropathology. In this study, we investigated age-dependent alterations of the axonal transport rate in the triple transgenic mouse olfactory system, using fast multi-sliced T(1) mapping with manganese-enhanced MRI. The data show that impairment in axonal transport is a very early event in AD pathology in these mice, preceding both deposition of Aβ plaques and formation of Tau fibrils.


Figures

Figure 1
Figure 1. MEMRI of a 3xTg-AD mouse
(A) T1w high resolution coronal MEMRI (Top) and sagittal MRI (Bottom) of a 3xTg-AD mouse showing slice positions of MEMRI data acquisition: (i) turbinate; (ii) olfactory bulb (OB) and (iii) lateral olfactory tracks (LOT) at 6h post MnCl2 administration. (B) Corresponding T1w high resolution (78 × 78 × 450 μm3) transverse images of (i) the turbinate at 1h, (ii) the OB at 6h, and (iii) the LOT at 24h post MnCl2 administration. (C) Extended view of the OB and a corresponding histological section of the OB illustrating the layered structure of the different cell types: the glomerular layer (GL); mitral cell layer (ML); external plexiform layer (EPL); and granule cell layer (GrO) [Image adapted from Wikipedia, public domain]. “R” in Fig. 1A and 1B indicates the animal’s right and “L” indicates the animal’s left.
Figure 2
Figure 2. Quantification of the axonal transport rate
Two sets (A and B) of T1 maps with corresponding T1w images of the OB of 3 mos old wt (A) and 3xTg-AD (B) mice at baseline, and 1h, 6h, and 24h post MnCl2 administration. The small square in the T1 map (top row right most) indicates the ROI inside of which the ATRI ((R1(6h) – R1(1h))/5) of the OB was calculated. The gradient bars indicate the range of T1 values from 0 s to 2.3 s. “R” in Fig. 2A (top row left most) indicates the animal’s right and “L” indicates the animal’s left; this orientation holds for all figures displayed. (C) Longitudinal relaxation rate (R1) at the OB of 3 mos old mice at baseline, and 1h, 6h, and 24h post MnCl2 administration, quantified from the ROI shown in Fig. 2A. (*: p = 0.04 for 1h; **: p = 0.005 for 6h; ***: p = 0.02 for 24h; n = 8 for wt and n = 5 for 3xTg-AD)
Figure 3
Figure 3. Axonal transport deficit in the OB
(A) T1 map with corresponding T1w MEMRI at the OB of a 3xTg-AD mouse at 2 mos of age. MEMRI was performed at 6h post MnCl2 administration. A small square in the upper panel shows an ROI where the ATRI in the OB (R1(6h)-R1(1h))/5) was obtained. The color scale bar indicates the range of T1 values of 0 - 2.3 s. (B) Comparison of the ATRI in the OB between wt and 3xTg-AD at 2 mos (n = 9 for wt, n = 8 for 3xTg-AD), 3 mos (n = 8 for wt, n = 4 for 3xTg-AD) and 15 mos (n = 5 for wt, n = 6 for 3xTg-AD) of age at the OB. (p=0.3 for 2 mos; *: p = 0.034 for 3 mos; p = 0.087 for 15 mos of age)
Figure 4
Figure 4. Axonal transport deficits in the LOT
(A) T1 map with corresponding T1w MEMRI at the LOT of a 3xTg-AD mouse at 2 mos of age. MEMRI was performed at 24h post MnCl2 administration. The circles indicate the LOT area with unilateral enhancement. A small square in the upper panel shows an ROI in which the ATRI ((R1(24h)-R1(Pre))/24) of the LOT was obtained. The color scale bar indicates the range of T1 values of 0 - 2.3 s. (B) Comparison of the ATRI in the LOT between wt and 3xTg-AD at 2 mos (n = 9 for wt and n = 8 for 3xTg-AD), 3 mos (n = 8 for wt and n = 5 for 3xTg-AD) and 15 mos (n = 5 for wt and n = 6 for 3xTg-AD). (p=0.88 for 2 mos; *: p = 0.039 for 3 mos; **: p = 0.028 for 15 mos of age)

References

    1. Billings LM, Oddo S, Green KN, McGaugh JL, LaFerla FM. Intraneuronal Abeta causes the onset of early Alzheimer’s disease-related cognitive deficits in transgenic mice. Neuron. 2005;45:675–688. - PubMed
    1. Chuang K, Koretsky AP. Improved neuronal tract tracing using manganese enhanced magnetic resonance imaging with Fast T1 mapping. Magn Reson Med. 2006;55:604–611. - PubMed
    1. Cross DJ, Minoshima S, Anzai Y, Flexman JA, Keogh BP, Kim Y, Maravilla KR. Statistical mapping of functional olfactory connections of the rat brain in vivo. NeuroImage. 2004;23:1326–1335. - PubMed
    1. Cross DJ, Flexman JA, Anzai Y, Maravilla KR, Minoshima S. Age-related decrease in axonal transport measured by MR imaging in vivo. NeuroImage. 2008;39:915–926. - PubMed
    1. De Vos K, Grierson AJ, Ackerley S, Miller CCJ. Role of Axonal Transport in Neurodegenerative Diseases. Annu Rev Neurosci. 2008;31:151–173. - PubMed

Publication types

MeSH terms