. 2011 Feb 21;192(4):675-90.
doi: 10.1083/jcb.201009135.

Inhibitory signaling blocks activating receptor clustering and induces cytoskeletal retraction in natural killer cells

Affiliations

Inhibitory signaling blocks activating receptor clustering and induces cytoskeletal retraction in natural killer cells

Thushara P Abeyweera et al. J Cell Biol. .

Abstract

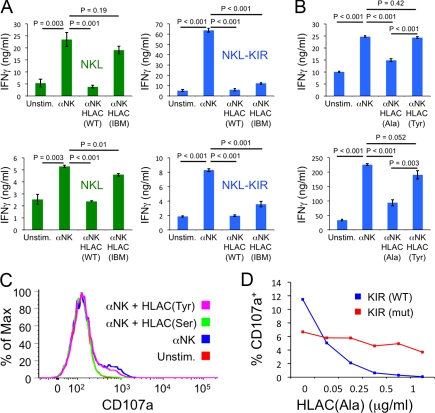
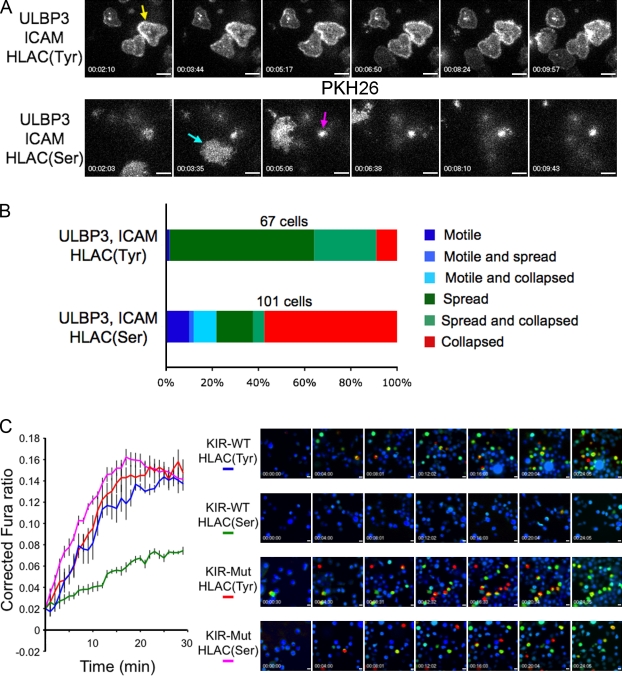
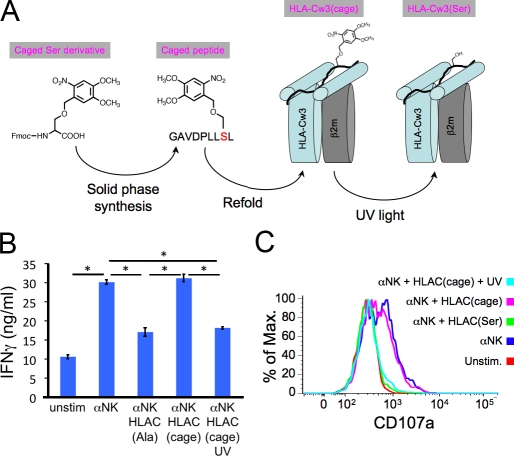
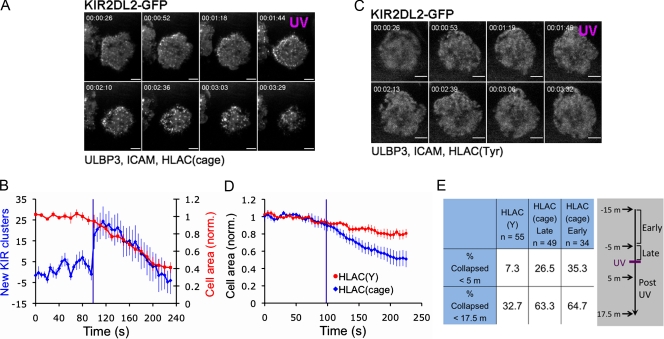
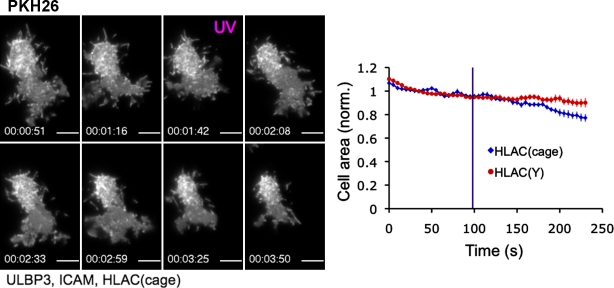
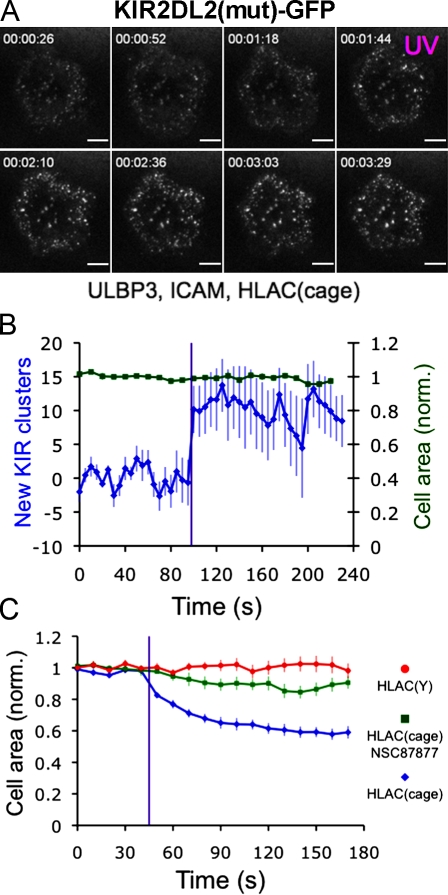
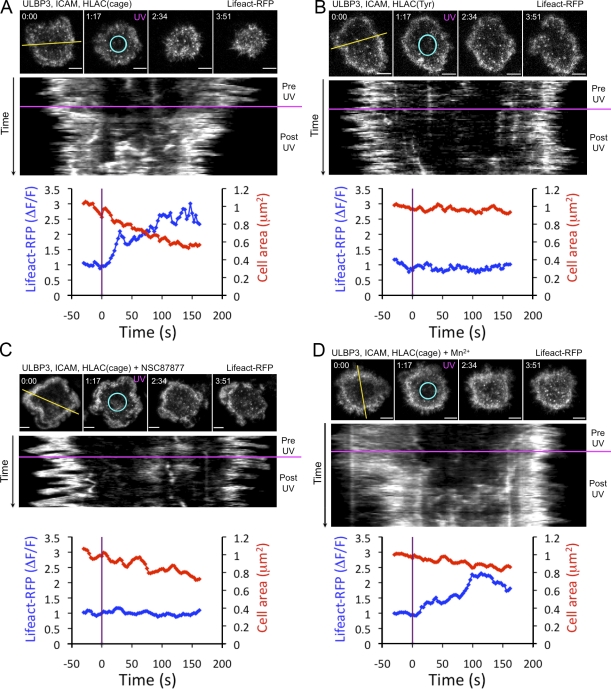
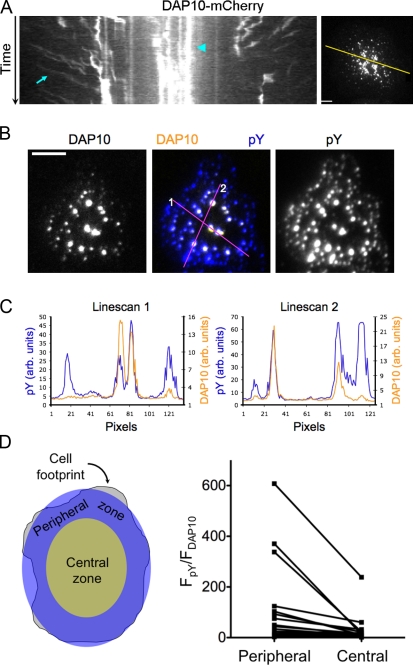
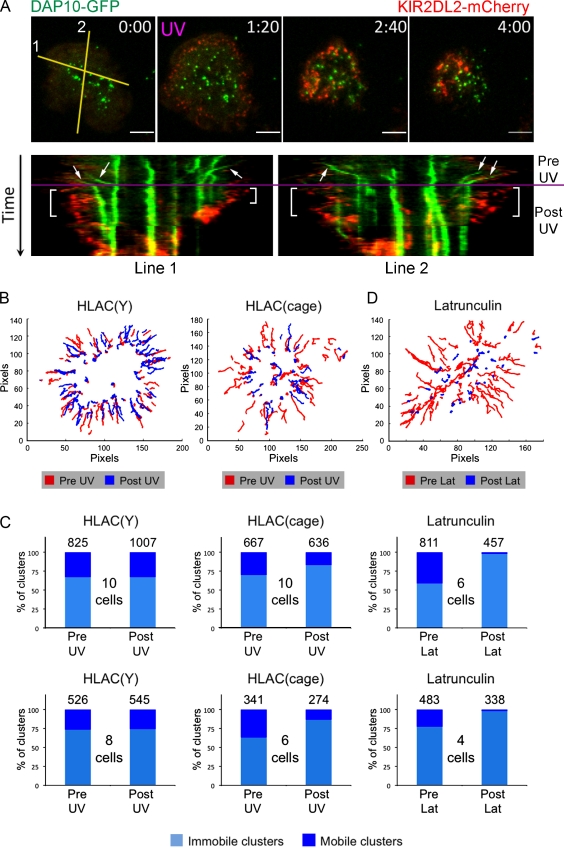
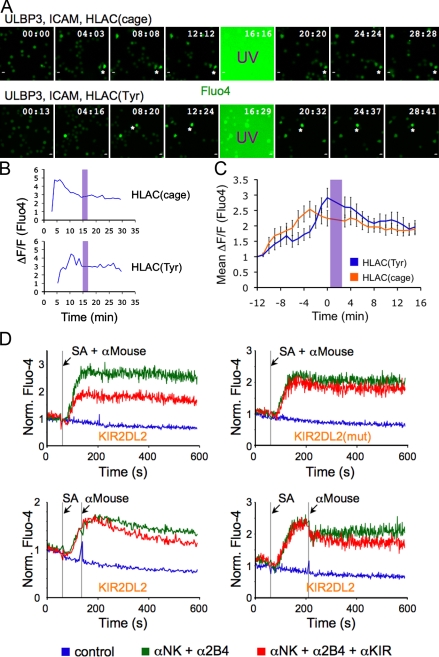
Natural killer (NK) lymphocytes use a variety of activating receptors to recognize and kill infected or tumorigenic cells during an innate immune response. To prevent targeting healthy tissue, NK cells also express numerous inhibitory receptors that signal through immunotyrosine-based inhibitory motifs (ITIMs). Precisely how signals from competing activating and inhibitory receptors are integrated and resolved is not understood. To investigate how ITIM receptor signaling impinges on activating pathways, we developed a photochemical approach for stimulating the inhibitory receptor KIR2DL2 during ongoing NK cell-activating responses in high-resolution imaging experiments. Photostimulation of KIR2DL2 induces the rapid formation of inhibitory receptor microclusters in the plasma membrane and the simultaneous suppression of microclusters containing activating receptors. This is followed by the collapse of the peripheral actin cytoskeleton and retraction of the NK cell from the source of inhibitory stimulation. These results suggest a cell biological basis for ITIM receptor signaling and establish an experimental framework for analyzing it.


Figures

Figure 1.
Figure 1.
KIR2DL2 signaling blocks activating responses. (A) Control NKL cells (left) and NKL cells expressing KIR2DL2 (right) were stimulated with α-NK and either wild-type (WT) HLA-Cw3 or HLA-Cw3 containing the ILT2-binding mutation (IBM) as indicated. Both HLA-Cw3 proteins contained the importin-α peptide with p8 Ala. IFN-γ secretion was quantified by ELISA. Two independent experiments are shown for each cell type. Although maximal IFN-γ secretion varied from day to day, the relative differences in cytokine production between different stimulus conditions were consistent. All other figures presented in this paper used HLA-Cw3 containing the ILT2-binding mutation. (B–D) NKL cells expressing wild-type KIR2DL2 (B–D) or KIR2DL2(mut) (D) were added to plastic wells containing immobilized α-NK and the indicated HLA-Cw3 proteins. (B) IFN-γ secretion from NKL cells expressing KIR2DL2, measured by ELISA. Two independent experiments are shown. (C) Representative degranulation responses measured by surface expression of CD107a. Unstim., unstimulated. As with IFN-γ secretion, maximal degranulation responses were quite variable. However, the relative differences between stimulus conditions were consistent. (D) Dose–response curves showing induced degranulation from NKL cells expressing either wild-type KIR2DL2 or KIR2DL2(mut) (both Tyr 302 and Tyr 332 mutated to Phe) as a function of the concentration of HLA-Cw3(Ala) used during protein immobilization. In A and B, error bars represent SEM between replicates, with n = 3. All data are representative of at least two independent experiments. P-values were calculated using Student’s t test.
Figure 2.
Figure 2.
KIR2DL2 signaling inhibits cell spreading and the initiation of Ca2+ flux. (A and B) NKL cells expressing KIR2DL2 were stained with PKH26 and imaged using TIRF microscopy on lipid bilayers containing the indicated proteins. (A) Representative time-lapse montages (∼90-s intervals) under both activating (top) and inhibitory (bottom) conditions. (B) Bar graph representing the distribution of cell behavior on surfaces containing the indicated ligands. Only cells visible in the imaging field for ≥5 min were analyzed. Cells were described as spread if they formed a stationary footprint at least 10 µm in diameter (yellow arrow in A), collapsed if they engaged in minimal dynamic interactions with the membrane (magenta arrow in A), or motile if they exhibited directional migration (cyan arrow in A). Occasionally, cells would display two phenotypes during the imaging period. (C) NKL cells expressing KIR2DL2 (KIR-WT) or KIR2DL2(mut) (KIR-Mut) were loaded with Fura-2AM and imaged on lipid bilayers containing ULBP3, ICAM, and the indicated HLA-Cw3 proteins. (right) Representative time-lapse montages (4-min intervals) showing a pseudocolored Fura-2AM ratio (warmer colors indicate higher intracellular Ca2+ concentrations). (left) Background-corrected mean Fura-2AM ratios for all imaging fields are plotted versus time for each condition. Error bars show SEM. All data are representative of at least two independent experiments. Bars, 10 µm.
Figure 3.
Figure 3.
Preparation of photocaged HLA-Cw3. (A) Photocaged Ser was synthesized and incorporated into the importin-α peptide, which was then refolded with purified HLA-Cw3 and β2m. UV irradiation of HLA-Cw3(cage) yields stimulatory HLA-Cw3(Ser). (B and C) IFN-γ secretion (B) and degranulation (C) of KIR2DL2-expressing NKL cells stimulated on plastic surfaces coated with the indicated activating and inhibitory molecules. HLA-Cw3(cage) was either UV irradiated or left untreated before immobilization on the stimulatory surfaces. Asterisks in B denote P < 0.001 (Student’s t test). Unstim, unstimulated. Error bars show SEM between replicates, with n = 3. Data are representative of at least three independent experiments.
Figure 4.
Figure 4.
Photostimulation of KIR2DL2 induces receptor microclusters and cellular retraction. (A–D) NKL cells expressing KIR2DL2-GFP were imaged using TIRF microscopy and UV irradiated on bilayers containing ULBP3, ICAM, and either HLA-Cw3(Tyr) or HLA-Cw3(cage). (A and C) Representative time-lapse montages (∼25-s intervals) showing NKL cells responding to photostimulation on surfaces containing the indicated proteins. UV irradiation is denoted in magenta. (B) Graph showing the change in KIR2DL2 microclusters and cell contact area after photostimulation on bilayers containing HLA-Cw3(cage). Data were derived from seven cells. (D) Graph showing mean cell contact area before and after photostimulation on bilayers containing the indicated HLA-Cw3 proteins. Each curve was derived from at least nine cells. (E) PKH26-stained NKL cells expressing KIR2DL2 were imaged on bilayers containing ULBP3, ICAM, and the indicated HLA-Cw3 proteins for up to 15 min before UV irradiation. Cells on the HLA-Cw3(cage) bilayer were grouped based on when they formed stable contacts with the bilayer (early, first 5 min; late, between 5 and 15 min) and how quickly they collapsed after UV (within 5 or 17.5 min). A timeline for the experiment is shown on the right in a gray box. Cells were defined as collapsed once their footprint on the bilayer shrank to <50% of its value before UV irradiation. Error bars represent SEM. Purple lines in graphs denote UV irradiation. All data are representative of at least two independent experiments. norm., normalized. Bars, 5 µm.
Figure 5.
Figure 5.
Photostimulation of KIR2DL3 triggers retraction in primary human NK cells. KIR2DL3+ NK cells were stained with PKH26 and photostimulated on bilayers containing ULBP3, ICAM, and either HLA-Cw3(cage) or HLA-Cw3(Tyr). (left) A time-lapse montage (∼25-s intervals) showing a representative photostimulation experiment on a bilayer containing HLA-Cw3(cage). UV irradiation is indicated in magenta. (right) A graph showing the mean cell contact area before and after photostimulation on bilayers containing the indicated HLA-Cw3 proteins. The purple line denotes UV irradiation. Each curve was derived from ≥15 cells. Error bars show SEM. Data are representative of two independent experiments. norm., normalized. Bars, 5 µm.
Figure 6.
Figure 6.
ITIM signaling and SHP-1/2 activity are required for cellular retraction. (A and B) NKL cells expressing KIR2DL2(mut)-GFP were imaged using TIRF microscopy and UV irradiated on bilayers containing ULBP3, ICAM, and HLA-Cw3(cage). (A) Time-lapse montage (∼25-s intervals) showing a representative response UV irradiation, which is indicated in magenta. (B) Graph showing the cell contact area and the change in KIR2DL2 microcluster number after photostimulation. Data were derived from 12 cells. (C) NKL cells expressing wild-type KIR2DL2 were photostimulated on bilayers containing ULBP3, ICAM, and the indicated HLA-Cw3 proteins in the presence or absence of NSC87877. Mean cell contact area is graphed both before and after UV irradiation. Each curve was derived from at least seven cells. Throughout the figure, purple lines indicate UV irradiation. Error bars show SEM. All data are representative of at least two independent experiments. norm., normalized. Bars, 5 µm.
Figure 7.
Figure 7.
KIR2DL2 photostimulation induces actin remodeling. (A–D) NKL cells expressing KIR2DL2 and Lifeact-RFP were imaged using TIRF microscopy and UV irradiated on bilayers containing ULBP3, ICAM, and either HLA-Cw3(cage) (A, C, and D) or HLA-Cw3(Tyr) (B). Photostimulation was performed using cells left untreated (A and B) or treated with NSC87877 (C) or Mn2+ (D). For each panel, a time-lapse montage (∼75-s intervals) is shown (top) along with an associated kymograph. UV irradiation is indicated by magenta text in the time lapse and by a magenta line in the kymograph. Kymographs were generated using the yellow line in the first image of each time lapse. Shown on the bottom in each panel, normalized mean fluorescence intensity of Lifeact-RFP in the center of the contact is graphed as a function of time together with cell area. The contact center is indicated by a cyan ellipse in each time lapse. Data are representative of at least two independent experiments. ΔF/F, normalized fluorescence intensity. Bars, 5 µm.
Figure 8.
Figure 8.
NKG2D stimulation induces the formation of activating receptor microclusters. (A) NKL cells expressing DAP10-mCherry were imaged using TIRF microscopy on bilayers containing ULBP3 and ICAM. (left) A kymograph showing centripetally mobile and stationary DAP10 clusters, indicated by the cyan arrow and arrowhead, respectively. The line used to generate the kymograph is shown on the right. (B–D) NKL cells expressing DAP10-GFP were fixed and stained with antibodies against phosphotyrosine (pY) on bilayers containing ULBP3 and ICAM. (B) Representative images showing DAP10 fluorescence (left), phosphotyrosine fluorescence (right), and the overlay (center). (C) Linescans depicting DAP10 and phosphotyrosine fluorescence (yellow and blue, respectively) in specific microclusters within the contact region. The lines used for each linescan are shown in the central image in B. (D, left) Schematic showing how images were divided into central and peripheral zones for quantification. (right) Before and after graph showing the ratio of normalized phosphotyrosine fluorescence intensity (FpY) to normalized DAP10-GFP fluorescence intensity (FDAP10) for peripheral and central regions. Ratios calculated from the same cell are connected by lines. All data are representative of at least two independent experiments. arb., arbitrary. Bars, 5 µm.
Figure 9.
Figure 9.
KIR2DL2 photostimulation blocks the formation of activating receptor microclusters. (A) NKL cells expressing DAP10-GFP and KIR2DL2-mCherry were imaged in TIRF mode and photostimulated on bilayers containing ULBP3, ICAM, and HLA-Cw3(cage). (top) A representative time-lapse montage (∼80-s intervals), with UV irradiation indicated by magenta text. (bottom) Two single-cell kymographs showing KIR2DL2-mCherry and DAP10-GFP clusters both before and after UV irradiation, which is indicated by the magenta line. Mobile clusters of DAP10 are denoted by arrows. Brackets indicate areas of the kymographs showing peripheral regions rich in KIR2DL2 microclusters but devoid of mobile DAP10 microclusters. Lines used for kymographs are shown in the first image of the time lapse. (B and D) Tracks of DAP10 microclusters in representative single cells. (B) Cells were imaged and UV irradiated on bilayers containing ULBP3, ICAM, and either HLA-Cw3(Tyr) (left) or HLA-Cw3(cage) (right). Paths traveled before UV irradiation are shown in red, and paths after UV irradiation are shown in blue. (D) Cells were treated with latrunculin (Lat) on bilayers containing ULBP3 and ICAM. Paths traveled before latrunculin addition are shown in red, and paths after latrunculin addition are shown in blue. (C) Bar graphs showing the relative amounts of mobile versus immobile DAP10 microclusters. (left and center) Cells were photostimulated on bilayers containing either HLA-Cw3(Tyr) (left) or HLA-Cw3(cage) (center). (right) Cells were treated with latrunculin on bilayers containing ULBP3 and ICAM. The total number of analyzed microclusters is indicated above each bar, and the number of analyzed cells for each experiment is shown between bars. The mean starting ratio of mobile to immobile microclusters differed from experiment to experiment. Hence, two independent experiments, each derived from cells imaged the same day, are shown for each condition. Bars, 5 µm.
Figure 10.
Figure 10.
Photostimulation of KIR2DL2 does not block ongoing Ca2+ responses. Fluo-4AM–loaded NKL cells expressing KIR2DL2 were imaged and UV irradiated on bilayers containing the indicated proteins. (A) Time-lapse montages (∼4-min intervals) showing Fluo-4AM responses before and after UV irradiation. Fluo-4AM fluorescence is proportional to intracellular Ca2+ concentration. (B) Ca2+ responses of two individual cells, which are indicated by asterisks in A. (C) Mean calcium responses for the entire population of cells. Each curve was derived from ≥30 cells. Error bars show SEM. In B and C, shaded purple bars denote UV irradiation. (D) Antibody cross-linking of KIR2DL2 does not inhibit ongoing Ca2+ responses. Fluo-4AM–loaded NKL cells expressing either wild-type KIR2DL2 or KIR2DL2(mut) were incubated with the indicated antibodies and subjected to flow cytometry. (top) SA (to cross-link α-NK and α-2B4) and α-Mouse (to cross-link α-KIR with α-NK and α-2B4) were added simultaneously as indicated. (bottom) α-Mouse was added after SA as indicated. All data are representative of at least two independent experiments. Norm., normalized. Bars, 10 µm.

References

    1. Abram C.L., Lowell C.A. 2009. The ins and outs of leukocyte integrin signaling. Annu. Rev. Immunol. 27:339–362 10.1146/annurev.immunol.021908.132554 - DOI - PMC - PubMed
    1. Arana E., Vehlow A., Harwood N.E., Vigorito E., Henderson R., Turner M., Tybulewicz V.L., Batista F.D. 2008. Activation of the small GTPase Rac2 via the B cell receptor regulates B cell adhesion and immunological-synapse formation. Immunity. 28:88–99 10.1016/j.immuni.2007.12.003 - DOI - PubMed
    1. Atwal J.K., Pinkston-Gosse J., Syken J., Stawicki S., Wu Y., Shatz C., Tessier-Lavigne M. 2008. PirB is a functional receptor for myelin inhibitors of axonal regeneration. Science. 322:967–970 10.1126/science.1161151 - DOI - PubMed
    1. Barber D.F., Faure M., Long E.O. 2004. LFA-1 contributes an early signal for NK cell cytotoxicity. J. Immunol. 173:3653–3659 - PubMed
    1. Billadeau D.D., Brumbaugh K.M., Dick C.J., Schoon R.A., Bustelo X.R., Leibson P.J. 1998. The Vav–Rac1 pathway in cytotoxic lymphocytes regulates the generation of cell-mediated killing. J. Exp. Med. 188:549–559 10.1084/jem.188.3.549 - DOI - PMC - PubMed

Publication types