. 2011 May;36(4):389-403.
doi: 10.1093/chemse/bjq148. Epub 2011 Feb 21.

Involvement of NADPH-dependent and cAMP-PKA sensitive H+ channels in the chorda tympani nerve responses to strong acids

Affiliations

Involvement of NADPH-dependent and cAMP-PKA sensitive H+ channels in the chorda tympani nerve responses to strong acids

John A DeSimone et al. Chem Senses. 2011 May.

Abstract

To investigate if chorda tympani (CT) taste nerve responses to strong (HCl) and weak (CO(2) and acetic acid) acidic stimuli are dependent upon NADPH oxidase-linked and cAMP-sensitive proton conductances in taste cell membranes, CT responses were monitored in rats, wild-type (WT) mice, and gp91(phox) knockout (KO) mice in the absence and presence of blockers (Zn(2+) and diethyl pyrocarbonate [DEPC]) or activators (8-(4-chlorophenylthio)-cAMP; 8-CPT-cAMP) of proton channels and activators of the NADPH oxidase enzyme (phorbol 12-myristate 13-acetate [PMA], H(2)O(2), and nitrazepam). Zn(2+) and DEPC inhibited and 8-CPT-cAMP, PMA, H(2)O(2), and nitrazepam enhanced the tonic CT responses to HCl without altering responses to CO(2) and acetic acid. In KO mice, the tonic HCl CT response was reduced by 64% relative to WT mice. The residual CT response was insensitive to H(2)O(2) but was blocked by Zn(2+). Its magnitude was further enhanced by 8-CPT-cAMP treatment, and the enhancement was blocked by 8-CPT-adenosine-3'-5'-cyclic monophospho-rothioate, a protein kinase A (PKA) inhibitor. Under voltage-clamp conditions, before cAMP treatment, rat tonic HCl CT responses demonstrated voltage-dependence only at ±90 mV, suggesting the presence of H(+) channels with voltage-dependent conductances. After cAMP treatment, the tonic HCl CT response had a quasi-linear dependence on voltage, suggesting that the cAMP-dependent part of the HCl CT response has a quasi-linear voltage dependence between +60 and -60 mV, only becoming sigmoidal when approaching +90 and -90 mV. The results suggest that CT responses to HCl involve 2 proton entry pathways, an NADPH oxidase-dependent proton channel, and a cAMP-PKA sensitive proton channel.


Figures

Figure 1
Figure 1
Effects of Zn2+ and DEPC on rat CT responses to acidic stimuli. (A) Shows a representative CT recording in which the rat tongue was first superfused with a rinse solution R1 (10 mM KCl) and then with 20 mM HCl solutions containing 0, 2.5, 5.0, and 10.0 mM ZnCl2. The arrows indicate the time period when the tongue was stimulated with different solutions. (B) The mean normalized tonic CT response in 3 rats to 20 mM HCl were plotted as a function of either Zn2+ (•) or DEPC (○) concentration. The tonic HCl CT responses at 10, 15, and 20 mM Zn2+ and 10 mM DEPC were not different from the baseline rinse values (P > 0.05). The P values were calculated with respect to the normalized HCl tonic CT response in the absence of Zn2+ or DEPC. The P values (*) at different Zn2+ concentration were 5 mM (0.0075), 10 mM (0.0023), 15 mM (0.0001), and 20 mM (0.0001) relative to control (0 Zn2+). The P values (*) at different DEPC concentration were 2.5 mM (0.0007), 5 mM (0.0001), and 10 mM (0.0001). (C) Shows a representative CT recording in which the rat tongue was first superfused with a rinse solution R1 (10 mM KCl) and then with acidic stimuli (20 mM HCl, 20 mM H3PO4, and 20 mM CH3COOH) in the absence and presence of 10 mM ZnCl2 (Zn2+). The control responses to 300 mM NH4Cl are shown at the beginning and end of the experiment and were nearly identical. The arrows indicate the time period when the tongue was stimulated with different solutions. (D) The mean normalized tonic CT response in 3 rats to 20 mM HCl, 20 mM H3PO4, and 20 mM CH3COOH are shown in the absence and presence of 10 mM ZnCl2 (Zn2+). The tonic CT response to HCl + Zn2+ was inhibited to the baseline rinse values (**P = 0.0004). There was no difference between the tonic CT response between CH3COOH and CH3COOH + Zn2+ (P > 0.05). Zn2+ inhibited the tonic CT response to H3PO4 by 65.8% (*P = 0.0016).
Figure 2
Figure 2
Effects of lingual voltage clamp, cAMP, and Zn2+ on the rat HCl CT response. (A) Rat CT responses 20 mM HCl were monitored at applied +90, +60, +30, 0, −30, −60, and −90 mV across the receptive field under control conditions and after topical lingual application of 15 mM 8-CPT-cAMP for 20 min. The mean normalized tonic HCl CT responses in 3 rats are plotted as a function of the applied voltage before (o; Control) and after cAMP treatment (•; Post-cAMP). The cAMP-dependent mean tonic responses (▴; cAMP dependent) at each applied voltage were calculated as the difference between the HCl CT response before and after cAMP treatment. The data points were fitted to the channel model described in the Appendix. (B) The mean normalized tonic CT responses in rats to 20 mM HCl and 20 mM HCl + 20 mM ZnCl2 are shown at +90, 0, and −90 mV applied voltage across the receptive field. cAMP significantly enhanced the HCl CT response at +90, 0, and −90 mV relative to control. Under control conditions, the P values were calculated with reference to the mean normalized tonic HCl CT response at 0 mV. The P values (*) at −90 and +90 mV were 0.0102 and 0.0158, respectively. Cyclic-AMP enhanced the HCl CT response at 0 mV relative to control (***P = 0.0001). Post-cAMP, the P values (**) at −90 and +90 mV were 0.001 and 0.0034, respectively with respect of 0 mV. Zn2+ inhibited the HCl CT responses at +90, 0, and −90 mV to the rinse baseline under control conditions and after cAMP treatment, (P > 0.05 with respect to zero). (C)Effect of Ca2+, Mg2+, and Zn2+ on the rat HCl CT response. The rat tongues were first superfused with a rinse solution R1 (10 mM KCl) and then with 20 mM HCl solutions containing 20 mM CaCl2, 20 mM MgCl2, or 20 mM ZnCl2. Addition of 20 mM CaCl2, 20 mM MgCl2, or 20 mM ZnCl2 to R1 did not increase the CT response above baseline relative to R1 alone (data not shown). The mean normalized tonic HCl CT responses in 3 rats are shown in the presence of Ca2+, Mg2+, and Zn2+. Whereas Zn2+ inhibited the mean normalized HCl tonic CT response to baseline (*P = 0.0001), Ca2+ and Mg2+ did not have any effect on the tonic HCl CT response (P > 0.05).
Figure 3
Figure 3
Effect of H2O2 on the rat HCl CT response. (A) The rat tongues were initially superfused with rinse solutions (R1; Table 1) containing H2O2 (R1 + 0, 2.5, 5.0, 10.0, and 15.0% H2O2) and then with 20 mM HCl solutions containing H2O2 (HCl + 0, 2.5, 5.0, 10.0, and 15.0% H2O2), respectively (see also Supplementary Figure 3). The H2O2-induced enhancement in the tonic HCl response at a particular H2O2 concentration was calculated relative to the baseline with the same H2O2 in R1. The mean normalized tonic HCl CT responses in 3 rats are plotted as a function of increasing H2O2 concentration. The P values were calculated with respect to the mean normalized HCl tonic CT response in the absence of H2O2. The P values (*) at different H2O2 concentrations were as follows: 5% (0.0019), 10% (0.0003), and 15% (0.0003). (B) CT responses were monitored while the rat tongues were superfusing with R1 and then with 20 mM HCl, R1 + 15% H2O2, and 20 mM HCl + 15% H2O2, R2 (pH 7.4) and 10% CO2 (pH 7.4; Table 1) and R3 (pH 6.1) and 525 mM CH3COOK + 30 mM CH3COOH (pH 6.1; Table 1). The mean normalized tonic CT responses in 3 rats to HCl, CO2, and CH3COOH are shown in the absence and presence of 15% H2O2. H2O2 only enhanced CT responses to HCl (*P = 0.0003). No significant difference was observed in the normalized tonic CT response to CO2 or CH3COOH (P > 0.05).
Figure 4
Figure 4
Effect of nitrazepam and PMA on the rat CT responses to acidic stimuli. (A) Shows a representative raw neural recording in which CT responses were monitored while the rat tongue was superfusing with R1 and then with 20 mM HCl, R2 and 10% CO2 (pH 7.4; Table 1), and R3 and 20 mM CH3COOH (pH 6.1; Table 1) before (Control) and after topical lingual application of 0.5 mM nitrazepam (Post-nitrazepam). The control responses to 300 mM NH4Cl are shown at the beginning and end of the experiment and were nearly identical. The arrows indicate the time period when the tongue was stimulated with different solutions. (B) The mean normalized tonic CT responses in 3 rats to HCl, CO2, and CH3COOH are shown before (Control) and after nitrazepam treatment (Post-nitrazepam). Nitrazepam only enhanced HCl CT responses (*P = 0.013). No effect of nitrazepam was observed on the CT responses to CO2 or CH3COOH relative to control (P >0.05). (C) Shows a representative CT recording in which the rat tongue was first superfused with a rinse solution R1 (10 mM KCl) and then with 20 mM HCl solution under control conditions and after topical lingual application of 0.25 mM PMA. The arrows indicate the time period when the tongue was stimulated with different solutions.
Figure 5
Figure 5
Effect of H2O2 and Zn2+ on HCl CT responses in WT and gp91phox KO mice. Shows representative normalized CT responses (A) in a WT mouse and (B) a KO mouse in which the tongues were initially superfused with rinse solutions R1, R1 + 15% H2O2, or R1 + 10 mM Zn2+ and then with 20 mM HCl, HCl + 15% H2O2, or HCl + 10 mM Zn2+. The arrows indicate the time period when the tongues were stimulated with different solutions.
Figure 6
Figure 6
Effect of H2O2 on the CT responses to HCl and CO2 in WT and gp91phox KO mice. Shows representative normalized CT responses (A) in a WT mouse and (B) a KO mouse in which the tongues were initially superfused with rinse solutions R1, R1 + 15% H2O2, R2 (pH 7.4), or R2 + 15% H2O2 (pH 7.4; Table 1) and then with 20 mM HCl, HCl + 15% H2O2, 10% CO2 (pH 7.4; Table 1), or 10% CO2 + 15% H2O2 (pH 7.4; Table 1). In (B) is also shown the response to R1, R1 + 10 mM Zn2+, 20 mM HCl, and 20 mM HCl + 10 mM Zn2+. The arrows indicate the time period when the tongues were stimulated with different solutions.
Figure 7
Figure 7
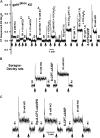
Effect of Zn2+, H2O2, and cAMP on the CT responses to HCl and CO2 in gp91phox KO mice and Sprague-Dawley rats. (A) Shows a representative CT recording in a gp91phox KO mouse in which the mouse tongue was initially superfused with R1, R1 + 10 mM Zn2+, R1 + 15% H2O2, R2 (pH 7.4), or R2 + 15% H2O2 (pH 7.4; Table 1) and then with 20 mM HCl, 20 mM HCl + 10 mM Zn2+, 20 mM HCl+15% H2O2, 10% CO2 (pH 7.4; Table 1) or 10% CO2 + 15% H2O2 (pH 7.4; Table 1). Also shown is the CT response to 20 mM HCl after the topical lingual application of 8-CPT-cAMP. The arrows indicate the time period when the tongue was stimulated with different solutions. (B) Shows a representative rat CT recording in which the tongue was first superfused with R1 and then with 20 mM HCl under control conditions and after topical lingual application of 15 mM 8-CPT-cAMP for 20 min. The arrows indicate the time period when the tongues were stimulated with different solutions. (C) Shows a representative rat CT recording in which the tongue was first superfused with R1 and then with 20 mM HCl under control conditions, after topical lingual application of 4.5 mM Rp-8-CPT-cAMPS for 10 min and after topical lingual application of 15 mM 8-CPT-cAMP (Table 2). The arrows indicate the time period when the tongues were stimulated with different solutions.
Figure 8
Figure 8
Effects of Zn2+, H2O2, and cAMP on the CT responses to acidic stimuli in WT and gp91phox KO mice. In 3 WT mice, the P values under different conditions were calculated with respect to the mean normalized tonic HCl CT response and were as follows: HCl + Zn2+ (****; 0.0001), HCl + H2O2 (**; 0.004), 10% CO2 (*; 0.0168), and 10% CO2 + H2O2 (***; 0.0014). In 6 KO mice, the P values under different conditions were calculated with respect to the mean normalized tonic HCl CT response and were as follows: HCl + Zn2+ (*; 0.0276), HCl + H2O2 (>0.05), 10% CO2 (*; 0.0295), 10% CO2 + H2O2 (*; 0.0295) and post-cAMP HCl (****; 0.0001). The mean tonic HCl CT response in KO mice was smaller relative to its value in WT mice (****P = 0.0001).

References

    1. Abaffy T, Trubey KR, Chaudhari N. Adenylate cyclase expression and modulation of cAMP in rat taste cells. Am J Physiol Cell Physiol. 2003;284:C1420–C1429. - PubMed
    1. Abramov AY, Jacobson J, Wientjes F, Hothersall J, Canevari L, Duchen MR. Expression and modulation of an NADPH oxidase in mammalian astrocytes. J Neurosci. 2005;25:9176–9184. - PMC - PubMed
    1. Botelho LHP, Rothermel JD, Coombs RV, Jastorff B. Cyclic AMP analog antagonists of cAMP action. Methods Enzymol. 1988;159:159–172. - PubMed
    1. Chandrashekar J, Yarmolinsky D, von Buchholtz L, Oka Y, Sly W, Ryba NJ, Zuker CS. The taste of carbonation. Science. 2009;326(5951):443–445. - PMC - PubMed
    1. Chang RB, Waters H, Liman ER. A proton current drives action potentials in genetically identified sour taste cells. Proc Natl Acad Sci U S A. 2010;107:22320–22325. - PMC - PubMed

Publication types

MeSH terms