. 2011 Mar;121(3):1141-53.
doi: 10.1172/JCI44417. Epub 2011 Feb 21.

Kaposi sarcoma herpesvirus (KSHV) vFLIP oncoprotein induces B cell transdifferentiation and tumorigenesis in mice

Affiliations

Kaposi sarcoma herpesvirus (KSHV) vFLIP oncoprotein induces B cell transdifferentiation and tumorigenesis in mice

Gianna Ballon et al. J Clin Invest. 2011 Mar.

Abstract

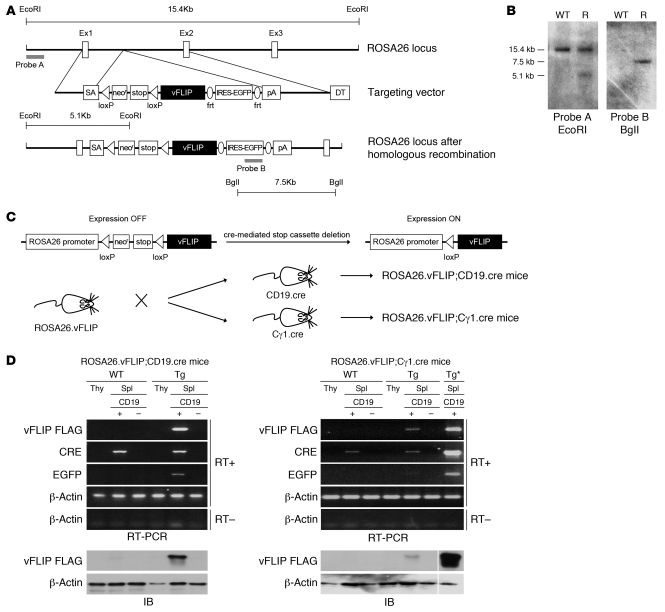
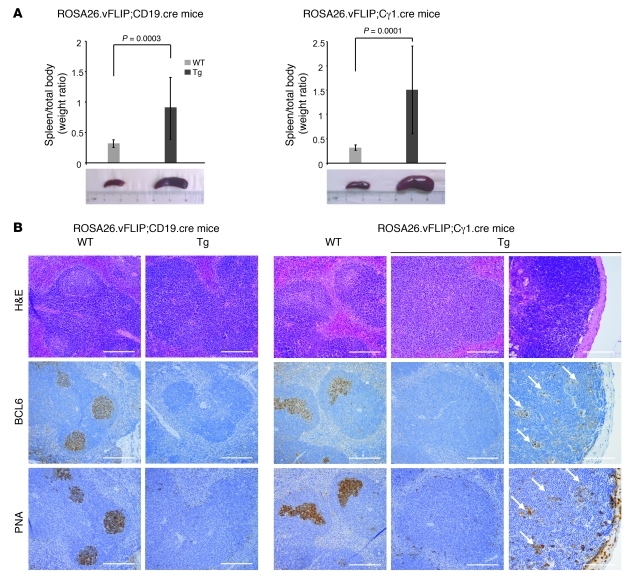
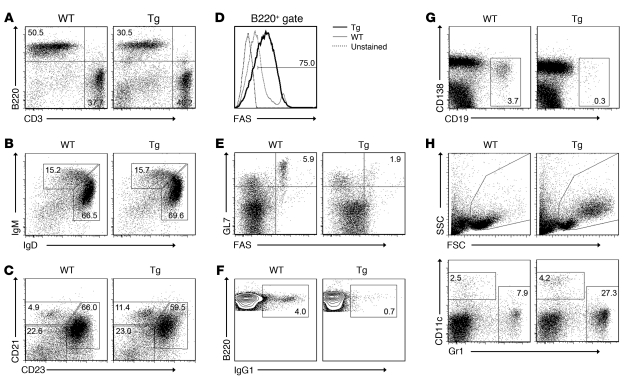
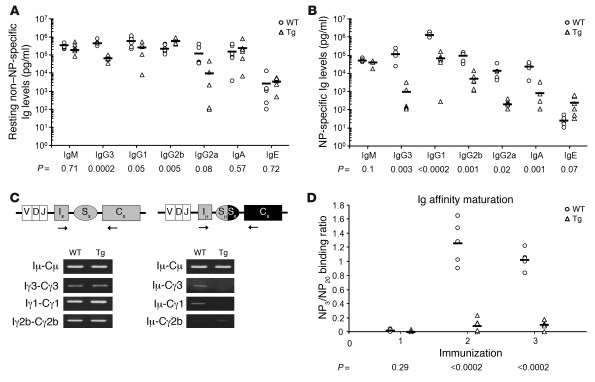
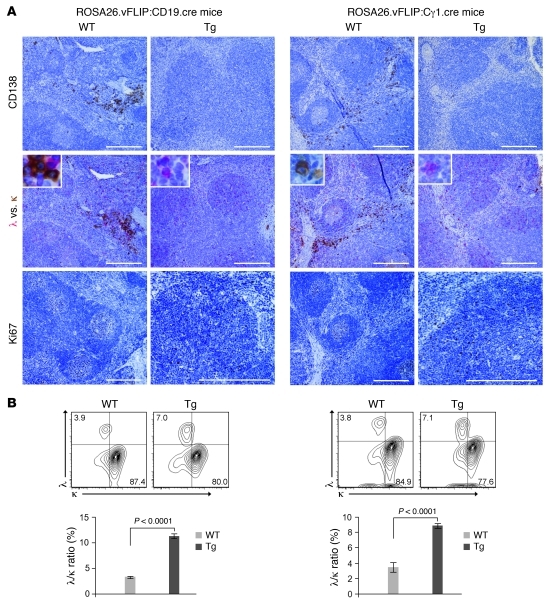
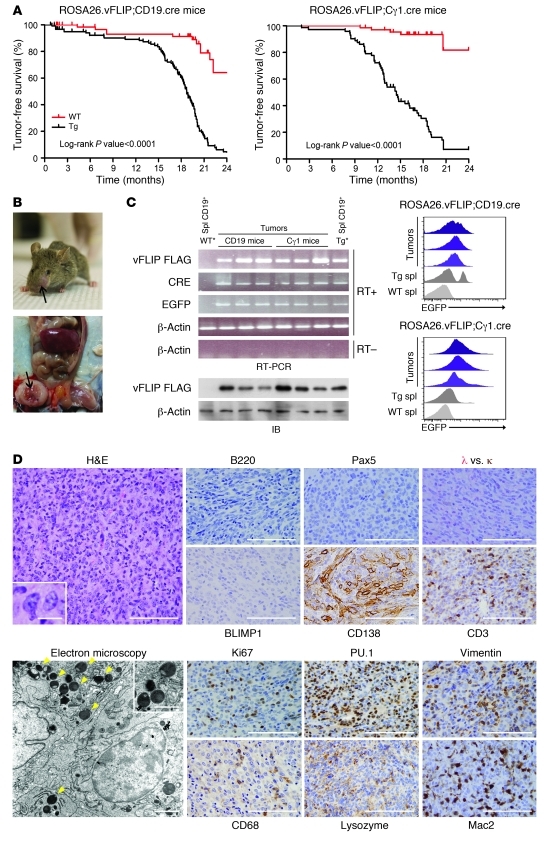
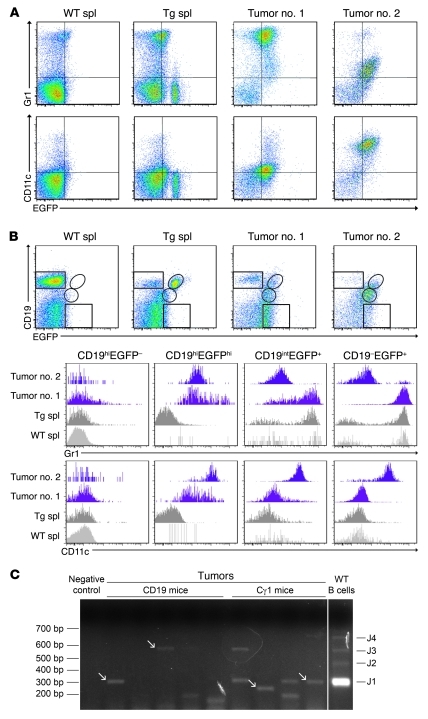
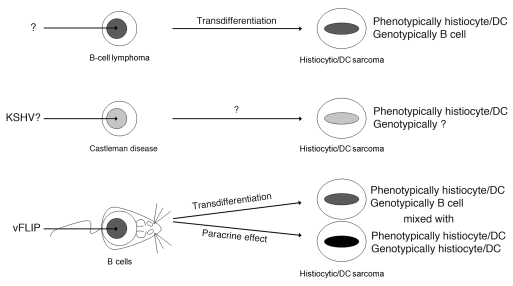
Kaposi sarcoma herpesvirus (KSHV) is specifically associated with Kaposi sarcoma (KS) and 2 B cell lymphoproliferative diseases, namely primary effusion lymphoma (PEL) and multicentric Castleman disease (MCD). KS, PEL, and MCD are largely incurable and poorly understood diseases most common in HIV-infected individuals. Here, we have revealed the role of viral FLICE-inhibitory protein (vFLIP) in the initiation of PEL and MCD by specifically expressing vFLIP at different stages of B cell differentiation in vivo. Mice showed MCD-like abnormalities and immunological defects including lack of germinal centers (GCs), impaired Ig class switching, and affinity maturation. In addition, they showed increased numbers of cells expressing cytoplasmic IgM-λ, a thus far enigmatic feature of the KSHV-infected cells in MCD. B cell-derived tumors arose at high incidence and displayed Ig gene rearrangement with downregulated expression of B cell-associated antigens, which are features of PEL. Interestingly, these tumors exhibited characteristics of transdifferentiation and acquired expression of histiocytic/dendritic cell markers. These results define immunological functions for vFLIP in vivo and reveal what we believe to be a novel viral-mediated tumorigenic mechanism involving B cell reprogramming. Additionally, the robust recapitulation of KSHV-associated diseases in mice provides a model to test inhibitors of vFLIP as potential anticancer agents.


Figures

Figure 1
Figure 1. Generation of ROSA26.vFLIP;CD19.cre and ROSA26.vFLIP;Cγ1.cre mice.
(A) Schematic representation of the ROSA26 locus before (top) and after (bottom) homologous recombination with the targeting vector (middle) carrying a triple-flagged vFLIP encoding sequence. (B) A representative Southern blot analysis of EcoRI- or BglI-digested WT and recombinant (R) ES cell DNA. Probes used and expected genomic fragment sizes are also indicated. (C) The strategy for recombinant activation of vFLIP expression in vivo. ROSA26.vFLIP knockin mice were bred with either CD19.cre or Cγ1.cre mice to obtain Tg expression from early precursor B cell stage or from GC stage, respectively. (D) Tg expression was specifically detected, both by RT-PCR (upper panel) and anti-FLAG immunoblotting (lower panel) in splenic CD19+ B cells derived from both ROSA26.vFLIP;CD19.cre and ROSA26.vFLIP;Cγ1.cre mice. Sample lanes separated by thin white lines were run on the same gel but were noncontiguous. Tg*, ROSA26.vFLIP;CD19.cre mice used for positive control; Spl, spleen; Thy, thymus.
Figure 2
Figure 2. Splenomegaly and lack of GC formation.
(A) Splenomegaly was observed in both ROSA26.vFLIP;CD19.cre (left) and ROSA26.vFLIP;Cγ1.cre mice (right); at least 20 Tg and control animals were analyzed (error bars indicate SEM). (B) H&E, PNA, and BCL6 staining revealed the lack of GCs in both Tg mouse lines. Abortive GCs in Peyer patches of ROSA26.vFLIP;Cγ1.cre mice are shown (arrows). Scale bars: 200 μm.
Figure 3
Figure 3. Abnormal splenic cell populations in ROSA26.vFLIP;CD19.cre mice.
Flow cytometry analysis displayed (A) decrease of B versus T cell ratio, as shown by B220 and CD3 staining; (B) no changes in immature (B220+IgDIgM+) and mature (B220+IgD+IgM) B cells; (C) no changes in follicular B cells (B220+CD21CD23+) and increase of marginal zone B cells (B220+CD21+CD23); (D) increase of FAS+ B cells; (E) reduction of GC B cells (B220+GL7+FAS+); (F) reduction of IgG1-expressing B cells; (G) reduction of plasma cells; (H) increase of side/forward scatter–high macrophage/DCs (SSC/FSChiB220 and Gr1+ or CD11c+). Data are representative of at least 3 experiments with similar results (error bars indicate SEM); at least 3 Tg and control animals were analyzed in each experiment.
Figure 4
Figure 4. Serum antibody concentration and Ig affinity maturation in ROSA26.vFLIP;CD19.cre mice.
Antibody levels were analyzed by ELISA. P values derived from Student’s t test on the means (bars) of WT versus Tg mice are given below each antibody subclass in the graphs. (A) Resting serum antibody levels evaluated on preimmune serum samples. (B) NP-specific antibody response referred to the second boost. (C) Post-switch transcripts were significantly reduced (right panel), except for Iμ-Cγ2b, although germline transcripts were unaffected (left panel). (D) Tg mice showed lack of affinity maturation upon sequential immunizations performed with NP24-KLH on days 0, 21, and 42, respectively. Higher NP3/NP20 binding ratios indicate the presence of higher-avidity (i.e., affinity-matured) IgG1 antibodies.
Figure 5
Figure 5. Expansion of Ki67+λ+ B cells.
(A) Spleen sections immunostained with CD138, λ (red), κ (brown), and Ki67. Insert shows higher magnification of cells expressing cytoplasmic λ and κ. Scale bars: 200 μm; 20 μm (insert). (B) Flow cytometry showing percentage of B cells expressing either intracellular λ or κ light chain (upper panel); λ versus κ ratio is also reported (lower panel). Data represent 1 of 3 experiments with similar results (error bars indicate SEM); at least 3 Tg and control animals were analyzed in each experiment.
Figure 6
Figure 6. Tumor characterization.
(A) Statistical analysis of event-free survival by Kaplan-Meier cumulative survival curve and the log-rank test to evaluate statistical significance. More than 100 mice in each group were followed up for up to 2 years. (B) A representative tumor in the nose and one in the abdominal cavity are shown. (C) Tg expression was detected in the tumors by RT-PCR (upper left panel), immunoblot (lower left panel), and flow cytometry (right panel). WT* and Tg*, ROSA26.vFLIP;CD19.cre mice were used for negative and positive controls, respectively. (D) Tumor sections were stained with H&E, B cell–specific markers (B220, Pax5, λ and κ), BLIMP1, and CD138 (upper panel). Tumors express markers indicative of histiocytic/DC sarcoma (Pu.1, Vimentin, CD68, Lysozyme, Mac2) (lower panels). Electron microscopy revealed electron-dense vesicles suggestive of lysozymes (arrows) (lower panels). Scale bars: 100 μm, 14 μm (inset), immuno­histo­chemistry images; 2 μm, 1.44 μm (inset), electron microscopy images.
Figure 7
Figure 7. Biphenotypic features of the B cell–derived transdifferentiated tumors.
(A) Flow cytometry showing Gr1 and/or CD11c expression in the EGFP+ tumor cells. Analysis of 2 representative tumors and control WT and Tg spleens is shown. (B) Many tumor cells express intermediate levels of CD19 and are, therefore, biphenotypic (i.e., CD19intGr1+ or CD19intCD11c+). (C) Tumor clonality analysis by RT-PCR with a set of forward primers covering the most commonly used IgVH gene families and reverse primers located in the JH1-4 gene segments. Polyclonal B cells show 4 bands, indicating JH1, JH2, JH3, and JH4 segments were rearranged, while many tumors gave 1 or 2 bands of different size, indicating monoclonal rearrangements. Arrows indicate monoclonal bands. Sample lanes separated by thin white lines were run on the same gel but were noncontiguous.
Figure 8
Figure 8. Model of vFLIP-mediated tumorigenesis, cell reprogramming, and paracrine stimulation of histiocytic/DCs.
The expression of KSHV vFLIP alone in B cells initially results in pathological alterations mimicking MCD and eventually leads to the development of B cell–derived tumors via transdifferentiation, as evidenced by the biphenotypic features of the tumor cells (i.e., phenotypically macrophage/DCs, genotypically B cells). This surprising phenotype has a correspondence in human pathology (i.e., development of follicular/DC sarcoma in a patient with previously diagnosed Castleman disease) and underlines an existing plasticity between B cell and macrophage/DC lineages, as recently reported also for other B cell malignancies (e.g., FL). Moreover, the expansion of phenotypically and genotypically genuine macrophage/DCs, as observed in the Tg mouse spleen, suggests that vFLIP-expressing B cells can sustain the proliferation of this compartment also via a paracrine mechanism. This process may contribute to the cell heterogeneity seen in KS, which is typically characterized by abundant histiocytic infiltrate of unknown origin and function.

Comment in

References

    1. Rous P. A sarcoma of the fowl transmissible by an agent separable from the tumor cells. J Exp Med. 1911;13(4):397–411. doi: 10.1084/jem.13.4.397. - DOI - PMC - PubMed
    1. Chang Y, et al. Identification of herpesvirus-like DNA sequences in AIDS-associated Kaposi’s sarcoma. Science. 1994;266(5192):1865–1869. doi: 10.1126/science.7997879. - DOI - PubMed
    1. Cesarman E, Chang Y, Moore PS, Said JW, Knowles DM. Kaposi’s sarcoma-associated herpesvirus-like DNA sequences in AIDS-related body-cavity-based lymphomas. N Engl J Med. 1995;332(18):1186–1191. doi: 10.1056/NEJM199505043321802. - DOI - PubMed
    1. Soulier J, et al. Kaposi’s sarcoma-associated herpesvirus-like DNA sequences in multicentric Castleman’s disease. Blood. 1995;86(4):1276–1280. - PubMed
    1. Carbone A, et al. Kaposi’s sarcoma-associated herpesvirus DNA sequences in AIDS-related and AIDS-unrelated lymphomatous effusions. Br J Haematol. 1996;94(3):533–543. doi: 10.1046/j.1365-2141.1996.d01-1826.x. - DOI - PubMed

Publication types

Substances