Review
. 2011 Feb 21;16(2):1776-803.
doi: 10.3390/molecules16021776.

Diversity of phage-displayed libraries of peptides during panning and amplification

Affiliations
Review

Diversity of phage-displayed libraries of peptides during panning and amplification

Ratmir Derda et al. Molecules. .

Abstract

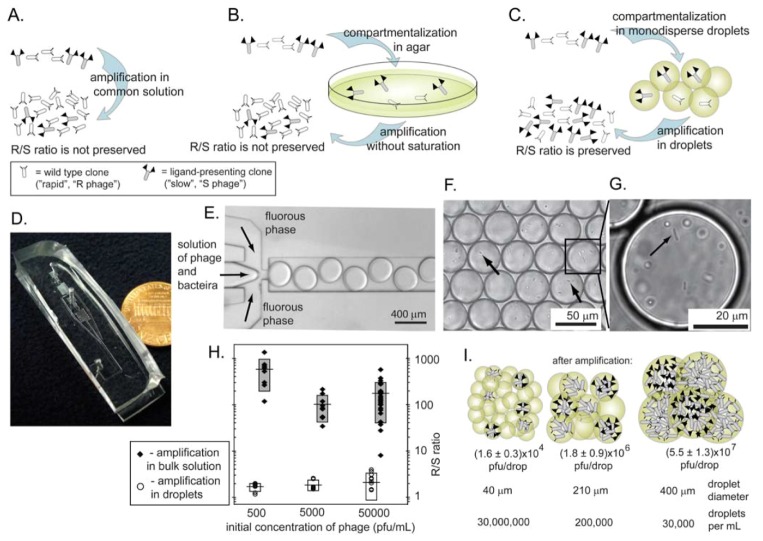
The amplification of phage-displayed libraries is an essential step in the selection of ligands from these libraries. The amplification of libraries, however, decreases their diversity and limits the number of binding clones that a screen can identify. While this decrease might not be a problem for screens against targets with a single binding site (e.g., proteins), it can severely hinder the identification of useful ligands for targets with multiple binding sites (e.g., cells). This review aims to characterize the loss in the diversity of libraries during amplification. Analysis of the peptide sequences obtained in several hundred screens of peptide libraries shows explicitly that there is a significant decrease in library diversity that occurs during the amplification of phage in bacteria. This loss during amplification is not unique to specific libraries: it is observed in many of the phage display systems we have surveyed. The loss in library diversity originates from competition among phage clones in a common pool of bacteria. Based on growth data from the literature and models of phage growth, we show that this competition originates from growth rate differences of only a few percent for different phage clones. We summarize the findings using a simple two-dimensional "phage phase diagram", which describes how the collapse of libraries, due to panning and amplification, leads to the identification of only a subset of the available ligands. This review also highlights techniques that allow elimination of amplification-induced losses of diversity, and how these techniques can be used to improve phage-display selection and enable the identification of novel ligands.


Figures

Figure 1
Figure 1
(A) A library of phage-displayed peptides contains clones that bind to a target better than other clones and clones that amplify faster than other clones. These characteristics are largely independent. (B) A round of panning enriches the phage clones that bind to the target. (C) A round of amplification enriches for the clones that amplify faster. Presenting the library as a circle in the (binding vs. growth)-phase diagram allows the description of (D) selection (R1S) as a collapse to the upper part of the circle and (E) amplification (R1A) as further collapse to the right part of the phase diagram. (F-G) The decrease in diversity in subsequent rounds of screening and amplification is identical to that in (D-E); it leads to a collapse of the sub-population to the upper-right portion. (G) After three rounds of selection, the screen identifies binding ligands. The number of identified ligands, however, is much smaller than the number of binders that were originally present in the library.
Figure 2
Figure 2
(A) We performed panning starting from the Ph.D.-12 phage library using hES cells as the target. Amplification occurred in a standard shaking culture. After each round of panning or amplification, we sequenced 40-50 clones. The plot in (A) summarizes the results from two independent experiments. The diversity of the library collapses at each amplification step. (B) Sequences from each round; repeating sequences are colored. (C) Distribution of the clones in the library can be presented as a stacked bar chart (D) in which the width of each black or white bar is proportional to the abundance of the peptide sequence. (E) presents the same data as A and B using stacked bars. Two replicates are presented independently. The right set of bars describe the abundance of individual amino acids in the library. (F) describes the sequencing results from Kelly et al. [46], and Li et al. [47]. (A and B are reproduced from Derda et al. [23] with permission). The frequencies of amino acids (AA) in E, G, F (and in subsequent Figure 3 and Figure 4) were calculated as (number of times AA encountered) / (total number of AAs in all sequences).
Figure 3
Figure 3
Analysis of the diversity of the Ph.D.-12 phage library after screening against various targets (see Figure 2 for an explanation of the stacked bar representation) from papers that report >15 DNA sequences. The data was extracted from raw MimoBD database [49] using a custom MatLab software. PMID is the PubMed ID of each article.
Figure 4
Figure 4
Analysis similar to Figure 3, but for Ph.D.-7 and Ph.D.-C7C libraries.
Figure 5
Figure 5
There is no correlation between the abundance of binding clones and their binding ability. (A-C) This example is from Feig and co-workers, who identified peptides that bind to Clostridium difficile toxins. After 4 rounds of panning, 61 clones were identified as binders and 118 clones had weak (or no) binding affinity [50]. (A) The Kd of the clones that bind. The horizontal position of each bar corresponds to the binder clone shown in the top stacked bar in (B). The width of the bar in A and B indicates the abundance of each clone. The binding affinity of each clone and its abundance in the sub-library are not correlated. (B) The distribution of the diversity in sub-populations of binders and non-binders are similar (both have several highly abundant clones). (C) Amino acid abundances are similar. (D-I) Results from other screens in the literature have the same trend as those in A: binding ability of the phage clones and their abundances are not correlated [53,54,55,56,57,58].
Figure 6
Figure 6
The kinetics of phage growth and its effects on the diversity of the library. (A) HAIYPRH-displaying phage amplifies faster than parent Ph.D.-7 library. In separate solutions, Ph.D.-7 library amplifies more slowly, but eventually reaches the same saturating concentration. (B) Competition of wild-type insert-free phage (R) and phages from Ph.D.-12 library (S) when these phage are amplified in the same solution. (C) Results from B overlaid with results from simulation of the competition between two clones. (D-G) A detailed description of the simulation: (D) Infection of phage (R or S) and bacteria (B) is a second order kinetic process with an infection rate constant kinf which produces infected bacteria (BR or BS). (E) BR or BS generate a burst of 1000 copies of R or S. Burst time follows a normal distribution. Average burst time is the only parameter that distinguishes R and S phage. (F) Infection by R or S converts bacteria B to BR or BS species that cannot be re-infected. (G) Bacteria grow via symmetric division according to substrate-limited Monod model. Growth rate of infected bacteria (BR or BS) is 2x slower than B. (A - adapted from Brammer et al. [39]; B – reproduced from Derda et al. [66] with permission).
Figure 7
Figure 7
A simulation of the growth of a library containing 100 different clones. (A and D) The initial population contains equal concentrations of the clones (numbered #1 through #100). The clones differ only in the time they are produced by the bacteria (average burst time is slowest for #1 and fastest for #100). We approximate the burst time of different clones in the population to follow a Gaussian distribution (i.e., the abundance of the fast and slow growers is low; most clones have an average growth rate). (B) Amplification of mixture of 100 copies of each clone using 108 bacteria (see Figure 6D-G for details of the amplification). In amplification from 104 pfu/mL to 1012 pfu/mL, the ratio of clone #1 (fastest) to clone #100 (slowest) reaches 5:1 (E). (C) Dilution of the amplification result from B to ~104 and re-amplification to 1012 further skews the distribution of the clones (F).
Figure 8
Figure 8
(A-C) Phage phase diagram illustrating that increasing the strength of the selection can minimize amplification of non-specific ligands.
Figure 9
Figure 9
Amplification methods that prevent competition between the phage. (A) Rapid R and slow S clones compete in the same solution. The R/S ratio is not preserved. (B) R and S are isolated in agar, but they do not amplify to completion. The R/S ratio is not preserved. (C) Amplification in monodisperse droplets isolates each phage to its own droplet; amplification to saturation preserves R/S ratio. (D) Photograph of the microfluidic device we used to isolate phage in separate monodisperse droplets. (E) Optical micrograph of the microfluidic device that generates droplets containing bacteria and phage in LB media suspended in a perfluorinated solvent as the carrier fluid. (F) Droplets contain bacteria (arrows) and phage. We generated these drops from a solution containing phage with an initial concentration such that each drop of a specific volume contains one or zero particles of phage. (G) Dividing bacteria inside the droplet. (H) Comparison of the amplification of a mixture of R and S phage (see Figure 6) in bulk solution or in the droplets. The R/S ratio is preserved in droplets and it increases by 100 to 300-fold in bulk solution. (F) The size of the droplets is important; the number of phage generated per droplet is proportional to the size of the droplet. Uniform amplification, thus, can be obtained in monodisperse droplets and not polydisperse emulsions. Reproduced from Derda et al. [66] with permission.

Similar articles

Cited by

References

    1. Devlin J.J., Panganiban L.C., Devlin P.E. Random Peptide Libraries - a Source of Specific Protein-Binding Molecules. Science. 1990;249:404–406. - PubMed
    1. McCafferty J., Griffiths A.D., Winter G., Chiswell D.J. Phage Antibodies - Filamentous Phage Displaying Antibody Variable Domains. Nature. 1990;348:552–554. - PubMed
    1. Barbas C.F., Bain J.D., Hoekstra D.M., Lerner R.A. Semisynthetic Combinatorial Antibody Libraries - a Chemical Solution to the Diversity Problem. Proc. Natl. Acad. Sci. USA. 1992;89:4457–4461. doi: 10.1073/pnas.89.10.4457. - DOI - PMC - PubMed
    1. Barbas C.F., Kang A.S., Lerner R.A., Benkovic S.J. Assembly of Combinatorial Antibody Libraries on Phage Surfaces - the Gene-Iii Site. Proc. Natl. Acad. Sci. USA. 1991;88:7978–7982. doi: 10.1073/pnas.88.18.7978. - DOI - PMC - PubMed
    1. Smith G.P. Filamentous Fusion Phage - Novel Expression Vectors That Display Cloned Antigens on the Virion Surface. Science. 1985;228:1315–1317. - PubMed

Publication types

LinkOut - more resources