. 2011 Feb 14;6(2):e17075.
doi: 10.1371/journal.pone.0017075.

A theoretical exploration of birhythmicity in the p53-Mdm2 network

Affiliations

A theoretical exploration of birhythmicity in the p53-Mdm2 network

Wassim Abou-Jaoudé et al. PLoS One. .

Abstract

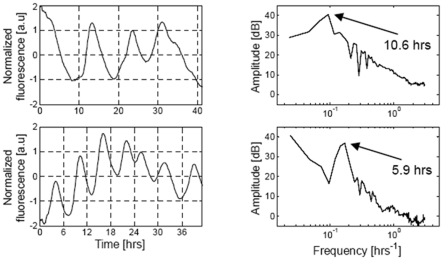
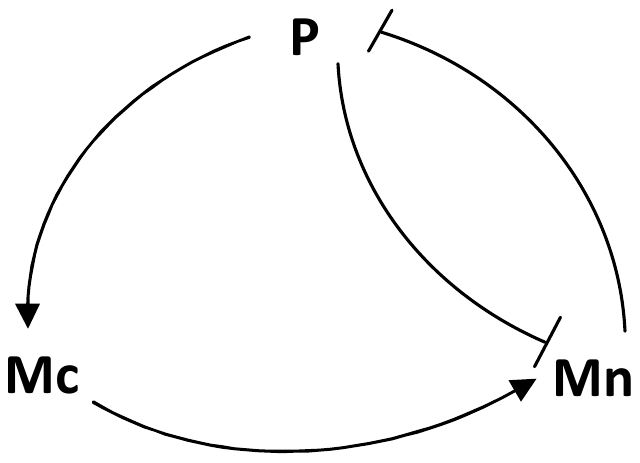
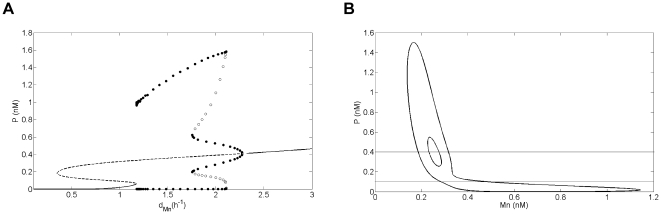
Experimental observations performed in the p53-Mdm2 network, one of the key protein modules involved in the control of proliferation of abnormal cells in mammals, revealed the existence of two frequencies of oscillations of p53 and Mdm2 in irradiated cells depending on the irradiation dose. These observations raised the question of the existence of birhythmicity, i.e. the coexistence of two oscillatory regimes for the same external conditions, in the p53-Mdm2 network which would be at the origin of these two distinct frequencies. A theoretical answer has been recently suggested by Ouattara, Abou-Jaoudé and Kaufman who proposed a 3-dimensional differential model showing birhythmicity to reproduce the two frequencies experimentally observed. The aim of this work is to analyze the mechanisms at the origin of the birhythmic behavior through a theoretical analysis of this differential model. To do so, we reduced this model, in a first step, into a 3-dimensional piecewise linear differential model where the Hill functions have been approximated by step functions, and, in a second step, into a 2-dimensional piecewise linear differential model by setting one autonomous variable as a constant in each domain of the phase space. We find that two features related to the phase space structure of the system are at the origin of the birhythmic behavior: the existence of two embedded cycles in the transition graph of the reduced models; the presence of a bypass in the orbit of the large amplitude oscillatory regime of low frequency. Based on this analysis, an experimental strategy is proposed to test the existence of birhythmicity in the p53-Mdm2 network. From a methodological point of view, this approach greatly facilitates the computational analysis of complex oscillatory behavior and could represent a valuable tool to explore mathematical models of biological rhythms showing sufficiently steep nonlinearities.


Conflict of interest statement

Competing Interests: The authors have declared that no competing interests exist.

Figures

Figure 1
Figure 1. Experimental data from (Geva-Zatorsky et al., 2006, Fig.S3) .
Power spectrum of nuclear Mdm2-YFP fluorescence dynamics in individual cells. Top: an example of a cell showing fluctuations with a characteristic frequency of ∼10 hours (exposed to 0.3Gy of gamma irradiation), and the power spectrum of the signal (by Fourier transform). Bottom: an example of a cell with multiple oscillations with a period of ∼6 hours (exposed to 5Gy), and the power spectrum of the signal (right). Reprinted by permission from Macmillan Publishers Ltd: Molecular Systems Biology, advance online publication, 2006 (doi: 10.1038/msb4100068).
Figure 2
Figure 2. Schematic representation of the p53-Mdm2 core network.
Normal arrows correspond to positive interactions, blunt arrows to negative interactions. P, Mc and Mn represent p53, cytoplasmic Mdm2 and nuclear Mdm2 respectively.
Figure 3
Figure 3. Bifurcation diagram and projection of the phase portrait of birhythmicity in the plane (Mn,P) for Model 1.
(A) Bifurcation diagram of p53 level as a function of dMn for Model 1. Solid lines (resp. dashed lines) represent the stable (resp. unstable) equilibrium points. Bold (resp. white) dots are the maxima and minima of the stable (resp. unstable) limit cycles. The system shows a birhythmic domain for 1.75 h−1<dMn<2.11 h−1. (B) Projection of the two oscillatory regimes on the plane (Mn,P) for Model 1 for dMn = 1.9 h−1. The thresholds KMc and KMn related to P are indicated in solid lines. The parameter values of Model 1 are the same as for the OAK Model (KMn = 0.1 nM) except: n = 6, dP = 2.5 h−1 and KMc = 0.4 nM (see legend of Figure S1 for the parameter values of the OAK Model).
Figure 4
Figure 4. Approximation of Hill function to step function.
Hill function formula image
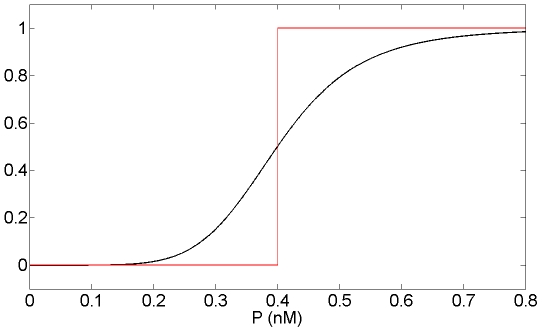
which appears in the equation of Mc in Model 1 (in black) and its approximation into the step function formula image defined as: formula image if formula image and formula image if formula image (in red) for n = 6 and KMc = 0.4 nM. n is the Hill coefficient and characterizes the steepness of the Hill function.
Figure 5
Figure 5. Subdivision of the phase space and graph of transitions for Model 2.
(A) Subdivision of the phase space for Model 2 in 6 domains delimited by the thresholds KP, KMn and KMc. (B) Graph of the transitions followed by the two oscillatory regimes composing birhythmicity shown in Figure 6. The small amplitude oscillatory regime of short period crosses domains D22, D12, D13 and D23 successively (in red). The large amplitude oscillatory regime of long period crosses domains: D22, D21, D11, D12, D13 and D23 successively (in green).
Figure 6
Figure 6. Projection of the phase portrait of birhythmicity in the plane (Mn,P) for Model 2.
Projection of the two oscillatory regimes composing the birhythmic behavior of Model 2 in the plane (Mn,P). The dashed lines represent the thresholds of the step functions: KMn and KMc for P, KP for Mn. The parameter values are the same as for Figure 3 (KMn = 0.1 nM, KP = 0.2 nM) except KMc = 0.6 nM. The period of the large amplitude oscillatory regime is significantly longer than the period of the small amplitude oscillatory regime (see Figure 8A and 8C).
Figure 7
Figure 7. Subdivision of the phase space and transition graph for Model 3.
(A) Subdivision of the phase space for Model 3 in 8 domains delimited by the thresholds KP, KMn, KMc and the additional threshold K (in red). (B) Transition graph of Model 3. The graph contains a branching point in domain D23 and two embedded cycles. From this domain, the system can either go to domain D13 or domain D22 depending on the initial conditions.
Figure 8
Figure 8. Temporal simulations for Model 2 and Model 3.
Temporal simulation (h) of the concentration (in nM) of p53 (P), cytoplasmic Mdm2 (Mc) and nuclear Mdm2 (Mn) for Model 2 (A and C) and Model 3 (B and D) in the small amplitude short period (A and B) and the large amplitude long period (C and D) oscillatory regime. For Model 3, Mc has been set as a constant Mcij in each domain Dij of the phase space following constraint (2) (see text). The parameter values are indicated in Figure 6 for Model 2 and in Figure 9 for Model 3.
Figure 9
Figure 9. Phase portrait of birhythmicity for Model 3.
Simulation of the two oscillatory regimes in the phase space for Model 3. The dashed lines represent the thresholds KMc, KMn and K for P, KP for Mn. The parameter values are the same as for Figure 6 (KMn = 0.1 nM) except KMc = 0.4 nM, K = 0.05 nM, KP = 2 nM, dP = 3 h−1, Mc11 = Mc21 = Mc12 = 0, Mc22 = 5 nM, Mc13 = 9 nM, Mc23 = 11.3 nM, Mc14 =  Mc24 = 25 nM. Note that, since the degradation constants dMn and dP have the same values, the trajectories in each domain are straight lines.
Figure 10
Figure 10. First return map analysis for Model 3.
(A and C) In red, simulation in the phase plane for the initial conditions Mn = 2 nM and P = 0.515 nM (x>xD, panel A) or P = 0.401 nM (x<xD, panel C) for Model 3. The dashed lines represent the thresholds KMc = 0.4 nM, KMn = 0.1 nM and K = 0.05 nM for P, KP = 2 nM for Mn. (B and D) In red, simulation of the orbit of the first return map from and to the [0, x) axis for the initials conditions of panel A (panel B) and panel C (panel D). The first return map F is shown in green and has been derived analytically (see Text S6). The parameter values are indicated in Figure 9. The discontinuity in F at x = xD∼0.077 arises when the trajectory hits the threshold intersection point (Mn = KP = 2, P = KMn = 0.1) (blue curve). The fixed points of F correspond to the two limit cycles of the system shown in Figure 9. For x>xD (resp. x<xD), the trajectory tends to the large (resp. small) amplitude oscillatory regime corresponding to the fixed point x = x2∼0.093 (resp. x = x1∼0.048).
Figure 11
Figure 11. Transition graph and first return map for the modified Model 3.
(A) Transition graph of the modified model 3. (B) Graph of the corresponding first return map (in green) from and to the [0, x) axis (see Figure 10). The parameter values are indicated in Figure 9, except Mc22 = 1. The focal point of D22 is now in D11 inducing the additional transition from D22 to D12 (arrow in red). The fixed points of the first return function correspond to limit cycles of the system. The system presents a unique limit cycle (x = x1∼0.048) corresponding to the small amplitude oscillatory regime (see Figure 10C and 10D). The first return map shows a non smooth point at xD∼0.077 (see Text S6).
Figure 12
Figure 12. Permanent shift from short to long period oscillatory regime after a transient p53 pulse.
Temporal simulation of p53 level for Model 3. A pulse of p53 is applied at t = 1.2 h (dashed line). Before applying the pulse, the system is oscillating in the small amplitude oscillatory regime. The p53 pulse induces a shift from the small amplitude short period to the large amplitude long period limit cycle. The parameter values are indicated in Figure 9.

References

    1. Goldbeter A. The molecular basis of periodic and chaotic behavior. Cambridge University Press; 1996. Biochemical Oscillations and Cellular Rythms.605
    1. Goldbeter A. Computational approaches to cellular rhythms. Nature. 2002;420:238–245. - PubMed
    1. Bar-Or RL, Maya R, Segel LA, Alon U, Levine AJ, et al. Generation of oscillations by the p53–mdm2 feedback loop: a theoretical and experimental study. Proc Natl Acad Sci USA. 2000;97:11250–11255. - PMC - PubMed
    1. Decroly O, Goldbeter A. Birhythmicity, chaos, and other patterns of temporal self-organization in a multiply regulated biochemical system. Proc Natl Acad Sci U S A. 1982;79:6917–6921. - PMC - PubMed
    1. Alamgir M, Epstein I. Birythmicity and compound oscillation in coupled chemical oscillators: chlorite-bromate-iodide system. J Am Chem Soc. 1983;105:2500–2501.

Publication types

Substances