. 2011 Nov;20(11):1889-900.
doi: 10.1089/scd.2010.0437. Epub 2011 Apr 3.

L3MBTL1 deficiency directs the differentiation of human embryonic stem cells toward trophectoderm

Affiliations

L3MBTL1 deficiency directs the differentiation of human embryonic stem cells toward trophectoderm

Ruben Hoya-Arias et al. Stem Cells Dev. 2011 Nov.

Abstract

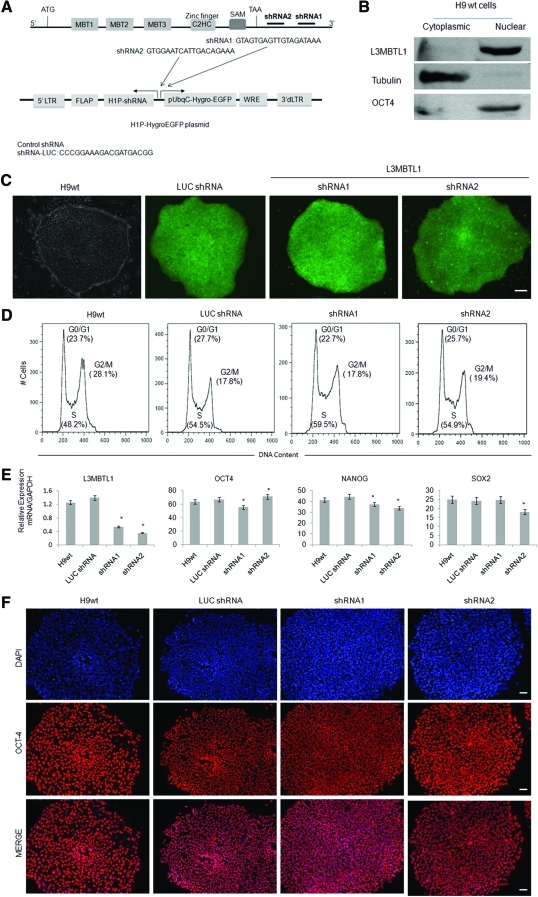
Human embryonic stem cells (hESCs) can be used to study the early events in human development and, hopefully, to understand how to differentiate human pluripotent cells for clinical use. To define how L3MBTL1, a chromatin-associated polycomb group protein with transcriptional repressive activities, regulates early events in embryonic cell differentiation, we created hESC lines that constitutively express shRNAs directed against L3MBTL1. The L3MBTL1 knockdown (KD) hESCs maintained normal morphology, proliferation, cell cycle kinetics, cell surface markers, and karyotype after 40 passages. However, under conditions that promote spontaneous differentiation, the L3MBTL1 KD cells differentiated into a relatively homogeneous population of large, flat trophoblast-like cells, unlike the multilineage differentiation seen with the control cells. The differentiated L3MBTL1 KD cells expressed numerous trophoblast markers and secreted placental hormones. Although the L3MBTL1 KD cells could be induced to differentiate into various embryonic lineages, they adopted an exclusive trophoblast fate during spontaneous differentiation. Our data demonstrate that depletion of L3MBTL1 does not affect hESC self-renewal, rather it enhances differentiation toward extra-embryonic trophoblast tissues.


Figures

FIG. 1.
FIG. 1.
Characterization of undifferentiated control and L3MBTL1 knockdown (KD) human embryonic stem cells. (A) Schematic representation of L3MBTL1 gene showing the location for the short hairpin (shRNA) sequences cloned into the H1P-HygroEGFP lentiviral plasmid. (B) Western blot of cytoplasmic and nuclear fractions from H9 parental cells shows nuclear location of L3MBTL1. Oct4 (nuclear) and tubulin (cytoplasmic) were used as controls. (C) Microscopic images showing the undifferentiated stage for the wt parental, LUC shRNA, L3MBTL1-shRNA1, and shRNA2 H9 cells based on their expression of GFP. Whole colonies were imaged on an Olympus epifluorescence system under a 10× objective. Scale bar represents 100 μm. (D) Cell cycle analysis of undifferentiated control and L3MBTL1KD ES cells. Relative DNA content, assessed by PI staining, shows the proportion of cells in the G1, G2, and S phases. A representative example of 3 independent experiments is shown. (E) Reverse transcriptase qPCR analysis comparing the level of L3MBTL1, OCT-4, NANOG, and SOX2 mRNA expression in control and L3MBTL1-depleted cells. Statistical analysis was performed by 1-way ANOVA and Tukey posttest (*P<0.05). Error bars represent the standard deviation (n=3). (F) Fluorescent microscopy images of OCT-4 with a DAPI DNA counterstain using the Olympus epifluorescence system under a 20× objective. Scale bar represents 50 μm. Color images available online at www.liebertonline.com/scd.
FIG. 2.
FIG. 2.
Morphological changes of spontaneously differentiated control and L3MBTL1 KD cells. (A) Photographs showing the morphological contrast between LUC shRNA and L3MBTL KD cells (left and right upper row, respectively); images were acquired using the Gel Doc System Quantity One software (BioRad). Lower row shows a magnified view of the differentiated L3MBTL1 KD cells (white circle); black lines show a phase-contrast image (left) and a DAPI/GFP fluorescence image (right). (B) L3MBTL1 KD cells fail to develop proper embryoid bodies. Fluorescent microscopic images showing EB derivation based on GFP expression for the LUC shRNA, shRNA1, and shRNA2 cell lines. Scale bars: 0.2 mm (4×); 100 μm (10×). Representative images of 3 independent experiments are shown. (C) Flow cytometry assay shows increasing cell death for the differentiated L3MBTL1 KD EB cells. Top plots show unstained control and L3MBTL1 KD EB cells and bottom plots show PE-Annexin V versus 7-AAD permeability profiles in the same cells. Apoptotic cells on the plots are Annexin V positive and PI negative (lower right quadrant), whereas necrotic cells are Annexin V positive and PI positive (upper right quadrant). (D) Expression of L3MBTL1, OCT-4, and NANOG in undifferentiated and differentiated state measured as relative level of mRNA/GAPDH. (E) mRNA expression levels of lineage cell markers SOX1 (ectoderm), AFP (endoderm), ACTC1 (mesoderm), and CG-β (trophoblast) in undifferentiated and differentiated states measured as relative level of mRNA/GAPDH. Statistical analysis was performed by 1-way ANOVA and Tukey posttest (*P<0.05). Error bars represent the standard deviation (n=3). Color images available online at www.liebertonline.com/scd.
FIG. 3.
FIG. 3.
Reverse transcriptase qPCR analysis for lineage cell markers. (A) Relative levels of mRNA expression of trophoblast marker CDX2. Error bars represent the standard deviation (n=3). (B) Trophoblast cell markers HAND1, GCM1, KRT7, and KRT8 in undifferentiated and differentiated states measured as relative level of mRNA/GAPDH. Statistical analysis was performed by 1-way ANOVA and Tukey posttest (*P<0.05). Error bars represent the standard deviation (n=3). (C) Immunofluorescent detection of HAND1. White arrows indicate the nuclear location of HAND1 protein. Microscopy performed with Olympus epifluorescence system under a 40× objective. Scale bar represents 50 μm. Representative images of 3 independent experiments are shown. (D) FACS analysis shows the percentage of spontaneously differentiated control and L3MBTL1 shRNA1 and shRNA2 cells expressing the trophectodermal (TE) marker HLA-G (red). Isotype control antibody staining is shown (black). Undifferentiated LUC shRNA and L3MBTL1 KD cells were used as negative controls for HLA-G staining (blue). Color images available online at www.liebertonline.com/scd.
FIG. 4.
FIG. 4.
L3MBTL1 knockdown mimics trophoblast differentiation induced by BMP4. Luciferase control with or without BMP4 and L3MBTL1 KD cells were cultured for 7 days. (A) Reverse transcriptase qPCR analysis for L3MBTL1, OCT-4, CG-β, and HAND1 mRNA expression. Statistical analysis was by 2-way ANOVA and Bonferroni posttest (*P<0.05). Error bars represent the standard deviation (n=3). (B) Phosphorylation of SMADS1/5/8 was examined by Western blot analysis in the homogenates of undifferentiated (day 1) and spontaneously differentiated (day 7) control LUC shRNA and L3MBTL1-KD cells. (C) Immunoassay for placental hormones CG-β and progesterone. Error bars represent the standard deviation (n=3). (D) L3MBTL1 KD cells differentiate under defined conditions. Fluorescence images of typical neuronal rosette structures at day 9 of directed neuroectoderm differentiation for control LUC shRNA and L3MBTL1 KD cell lines (upper panel) are shown. Scale bar represents 50 μm. Representative images of 3 independent experiments are shown. Reverse transcriptase qPCR analysis results for neuroectoderm markers SOX-1 and PAX6 mRNA expression (bottom panel) are also shown. Statistical analysis was performed by 2-way ANOVA and Bonferroni posttest (*P<0.05). Error bars represent the standard deviation (n=3). Color images available online at www.liebertonline.com/scd.

References

    1. Keller G. Embryonic stem cell differentiation: emergence of a new era in biology and medicine. Genes Dev. 2005;19:1129–1155. - PubMed
    1. Auman HJ. Nottoli T. Lakiza O. Winger Q. Donaldson S. Williams T. Transcription factor AP-2gamma is essential in the extra-embryonic lineages for early postimplantation development. Development. 2002;129:2733–2747. - PubMed
    1. Donnison M. Beaton A. Davey HW. Broadhurst R. L'Huillier P. Pfeffer PL. Loss of the extraembryonic ectoderm in Elf5 mutants leads to defects in embryonic patterning. Development. 2005;132:2299–2308. - PubMed
    1. Ralston A. Cox BJ. Nishioka N. Sasaki H. Chea E. Rugg-Gunn P. Guo G. Robson P. Draper JS. Rossant J. Gata3 regulates trophoblast development downstream of Tead4 and in parallel to Cdx2. Development. 137:395–403. - PubMed
    1. Russ AP. Wattler S. Colledge WH. Aparicio SA. Carlton MB. Pearce JJ. Barton SC. Surani MA. Ryan K. Nehls MC. Wilson V. Evans MJ. Eomesodermin is required for mouse trophoblast development and mesoderm formation. Nature. 2000;404:95–99. - PubMed

Publication types

MeSH terms