. 2011 Feb 22:9:18.
doi: 10.1186/1741-7015-9-18.

EEG complexity as a biomarker for autism spectrum disorder risk

Affiliations

EEG complexity as a biomarker for autism spectrum disorder risk

William Bosl et al. BMC Med. .

Abstract

Background: Complex neurodevelopmental disorders may be characterized by subtle brain function signatures early in life before behavioral symptoms are apparent. Such endophenotypes may be measurable biomarkers for later cognitive impairments. The nonlinear complexity of electroencephalography (EEG) signals is believed to contain information about the architecture of the neural networks in the brain on many scales. Early detection of abnormalities in EEG signals may be an early biomarker for developmental cognitive disorders. The goal of this paper is to demonstrate that the modified multiscale entropy (mMSE) computed on the basis of resting state EEG data can be used as a biomarker of normal brain development and distinguish typically developing children from a group of infants at high risk for autism spectrum disorder (ASD), defined on the basis of an older sibling with ASD.

Methods: Using mMSE as a feature vector, a multiclass support vector machine algorithm was used to classify typically developing and high-risk groups. Classification was computed separately within each age group from 6 to 24 months.

Results: Multiscale entropy appears to go through a different developmental trajectory in infants at high risk for autism (HRA) than it does in typically developing controls. Differences appear to be greatest at ages 9 to 12 months. Using several machine learning algorithms with mMSE as a feature vector, infants were classified with over 80% accuracy into control and HRA groups at age 9 months. Classification accuracy for boys was close to 100% at age 9 months and remains high (70% to 90%) at ages 12 and 18 months. For girls, classification accuracy was highest at age 6 months, but declines thereafter.

Conclusions: This proof-of-principle study suggests that mMSE computed from resting state EEG signals may be a useful biomarker for early detection of risk for ASD and abnormalities in cognitive development in infants. To our knowledge, this is the first demonstration of an information theoretic analysis of EEG data for biomarkers in infants at risk for a complex neurodevelopmental disorder.


Figures

Figure 1
Figure 1
Characteristics of five different time series are shown. Column 1 shows the time series amplitudes. Column 2 represents the multiscale entropy, where the horizontal axis is the coarse-grained scale from 1 to 20. Column 3 is the multiscale time asymmetry value. The value of a in the lower right corner of the time asymmetry plot is the value of the time asymmetry index summed over scales 1 to 5. A nonzero time asymmetry value is a sufficient condition for nonlinearity of a time series.
Figure 2
Figure 2
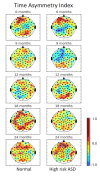
Time asymmetry index for typical control group and the group of infants at high risk for autism is shown. The index was averaged over all infants in the group and age categories. If time asymmetry varied randomly at channel locations, the fluctuations would average out. The persistence of time asymmetry values different from zero indicates nonlinearity in the signal.
Figure 3
Figure 3
Modified multiscale entropy (mMSE) is computed for each of 64 channels and for each of the risk groups and averaged over the sample population to produce the mMSE plots for infants ages 6 to 24 months.
Figure 4
Figure 4
The change in mean modified multiscale entropy (mMSE) over all channels is shown for each age. Averaging over all channels reveals that, in general, mMSE is higher in the typical control group than in the group of infants at high risk for autism, but regional differences cannot be seen. Numerical data, including the statistical significance of group differences, are contained in Table 1.
Figure 5
Figure 5
Mean modified multiscale entropy in each electroencephalography channel averaged over all infants at each age in (a) the typical control group or (b) the group of infants at high risk for autism.
Figure 6
Figure 6
Mean modified multiscale entropy curves for all 64 channels grouped by brain region for a single 9-month-old infant from the typical control group. Higher low spatial region (corresponding to high frequency) entropy in the frontal region is one distinct difference in the control example compared to the infants at high risk for autism example in Figure 7.
Figure 7
Figure 7
This figure is analogous to Figure 6, but for a single 9-month-old infant from the high risk group. Figures 6 and 7 illustrate that the shape of the modified multiscale entropy curve may contain information not seen when using averages alone as in previous scalp plots.

Comment in

References

    1. Buzsáki G. Rhythms of the Brain. New York: Oxford University Press; 2006.
    1. Barabasi AL. Scale-free networks: a decade and beyond. Science. 2009;325:412–413. doi: 10.1126/science.1173299. - DOI - PubMed
    1. Bassett DS, Bullmore E. Small-world brain networks. Neuroscientist. 2006;12:512–523. doi: 10.1177/1073858406293182. - DOI - PubMed
    1. Ravasz E, Barabási AL. Hierarchical organization in complex networks. Phys Rev E Stat Nonlin Soft Matter Phys. 2003;67:026112. doi: 10.1103/PhysRevE.67.026112. - DOI - PubMed
    1. Supekar K, Musen M, Menon V. Development of large-scale functional brain networks in children. PLoS Biol. 2009;7:e1000157. doi: 10.1371/journal.pbio.1000157. - DOI - PMC - PubMed

Publication types

LinkOut - more resources