

Nonsynonymous substitution rate (Ka) is a relatively consistent parameter for defining fast-evolving and slow-evolving protein-coding genes
- PMID: 21342519
- PMCID: PMC3055854
- DOI: 10.1186/1745-6150-6-13
Nonsynonymous substitution rate (Ka) is a relatively consistent parameter for defining fast-evolving and slow-evolving protein-coding genes
Abstract
Background: Mammalian genome sequence data are being acquired in large quantities and at enormous speeds. We now have a tremendous opportunity to better understand which genes are the most variable or conserved, and what their particular functions and evolutionary dynamics are, through comparative genomics.
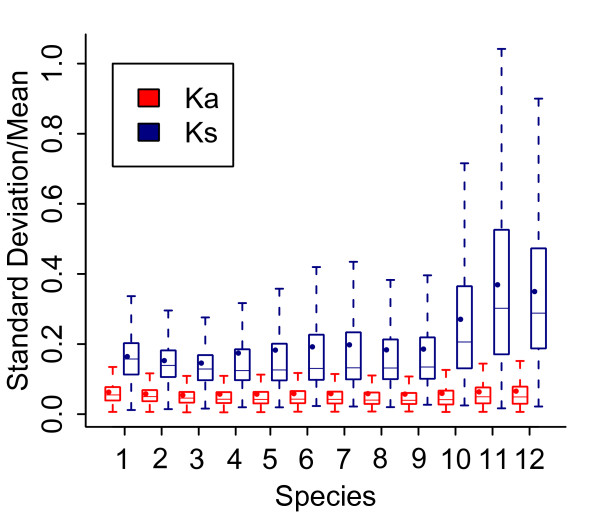
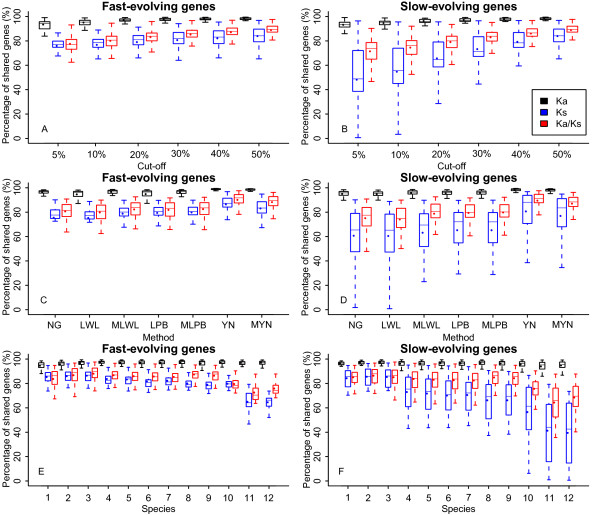
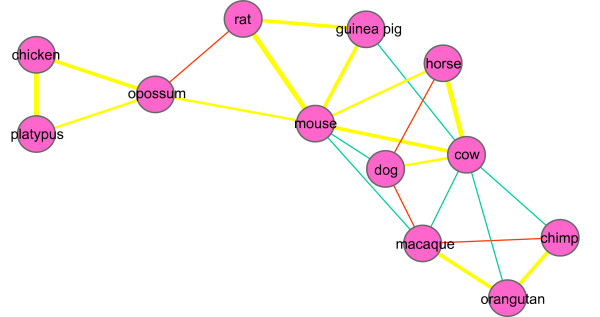
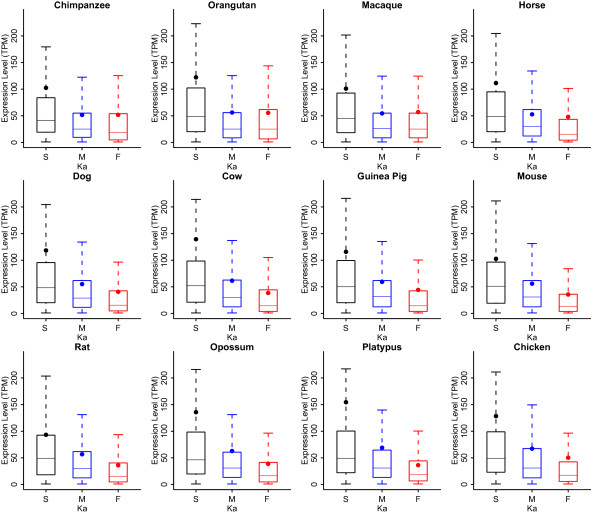
Results: We chose human and eleven other high-coverage mammalian genome data-as well as an avian genome as an outgroup-to analyze orthologous protein-coding genes using nonsynonymous (Ka) and synonymous (Ks) substitution rates. After evaluating eight commonly-used methods of Ka and Ks calculation, we observed that these methods yielded a nearly uniform result when estimating Ka, but not Ks (or Ka/Ks). When sorting genes based on Ka, we noticed that fast-evolving and slow-evolving genes often belonged to different functional classes, with respect to species-specificity and lineage-specificity. In particular, we identified two functional classes of genes in the acquired immune system. Fast-evolving genes coded for signal-transducing proteins, such as receptors, ligands, cytokines, and CDs (cluster of differentiation, mostly surface proteins), whereas the slow-evolving genes were for function-modulating proteins, such as kinases and adaptor proteins. In addition, among slow-evolving genes that had functions related to the central nervous system, neurodegenerative disease-related pathways were enriched significantly in most mammalian species. We also confirmed that gene expression was negatively correlated with evolution rate, i.e. slow-evolving genes were expressed at higher levels than fast-evolving genes. Our results indicated that the functional specializations of the three major mammalian clades were: sensory perception and oncogenesis in primates, reproduction and hormone regulation in large mammals, and immunity and angiotensin in rodents.
Conclusion: Our study suggests that Ka calculation, which is less biased compared to Ks and Ka/Ks, can be used as a parameter to sort genes by evolution rate and can also provide a way to categorize common protein functions and define their interaction networks, either pair-wise or in defined lineages or subgroups. Evaluating gene evolution based on Ka and Ks calculations can be done with large datasets, such as mammalian genomes.
Reviewers: This article has been reviewed by Drs. Anamaria Necsulea (nominated by Nicolas Galtier), Subhajyoti De (nominated by Sarah Teichmann) and Claus O. Wilke.
Figures
Similar articles
-
Gamma-MYN: a new algorithm for estimating Ka and Ks with consideration of variable substitution rates.Biol Direct. 2009 Jun 16;4:20. doi: 10.1186/1745-6150-4-20. Biol Direct. 2009. PMID: 19531225 Free PMC article.
-
Molecular evolution of Drosophila cuticular protein genes.PLoS One. 2009 Dec 17;4(12):e8345. doi: 10.1371/journal.pone.0008345. PLoS One. 2009. PMID: 20019874 Free PMC article.
-
Molecular evolution of the plastid genome during diversification of the cotton genus.Mol Phylogenet Evol. 2017 Jul;112:268-276. doi: 10.1016/j.ympev.2017.04.014. Epub 2017 Apr 13. Mol Phylogenet Evol. 2017. PMID: 28414099
-
Can RNA selection pressure distort the measurement of Ka/Ks?Gene. 2006 Mar 29;370:1-5. doi: 10.1016/j.gene.2005.12.015. Epub 2006 Feb 20. Gene. 2006. PMID: 16488091 Review.
-
Conserved elements within open reading frames of mammalian Hox genes.J Biol. 2009;8(2):17. doi: 10.1186/jbiol116. Epub 2009 Feb 6. J Biol. 2009. PMID: 19226447 Free PMC article. Review.
Cited by
-
Transposon-derived and satellite-derived repetitive sequences play distinct functional roles in Mammalian intron size expansion.Evol Bioinform Online. 2012;8:301-19. doi: 10.4137/EBO.S9758. Epub 2012 Jun 19. Evol Bioinform Online. 2012. PMID: 22807622 Free PMC article.
-
Evolution of Transcriptional Repressors Impacts Caenorhabditis Vulval Development.Mol Biol Evol. 2020 May 1;37(5):1350-1361. doi: 10.1093/molbev/msaa009. Mol Biol Evol. 2020. PMID: 31960924 Free PMC article.
-
Frequent lineage-specific substitution rate changes support an episodic model for protein evolution.G3 (Bethesda). 2021 Dec 8;11(12):jkab333. doi: 10.1093/g3journal/jkab333. G3 (Bethesda). 2021. PMID: 34542594 Free PMC article.
-
Comparison of the chloroplast genomics of nine endangered Habenaria species and phylogenetic analysis.BMC Plant Biol. 2024 Nov 5;24(1):1046. doi: 10.1186/s12870-024-05766-2. BMC Plant Biol. 2024. PMID: 39497089 Free PMC article.
-
Evolution of the Araliaceae family inferred from complete chloroplast genomes and 45S nrDNAs of 10 Panax-related species.Sci Rep. 2017 Jul 7;7(1):4917. doi: 10.1038/s41598-017-05218-y. Sci Rep. 2017. PMID: 28687778 Free PMC article.
References
-
- Bustamante CD, Fledel-Alon A, Williamson S, Nielsen R, Hubisz MT, Glanowski S, Tanenbaum DM, White TJ, Sninsky JJ, Hernandez RD, Civello D, Adams MD, Cargill M, Clark AG. Natural selection on protein-coding genes in the human genome. Nature. 2005;437:1153–1157. doi: 10.1038/nature04240. - DOI - PubMed
Publication types
MeSH terms
LinkOut - more resources
Full Text Sources
Other Literature Sources
