

The choice of null distributions for detecting gene-gene interactions in genome-wide association studies
- PMID: 21342556
- PMCID: PMC3044281
- DOI: 10.1186/1471-2105-12-S1-S26
The choice of null distributions for detecting gene-gene interactions in genome-wide association studies
Abstract
Background: In genome-wide association studies (GWAS), the number of single-nucleotide polymorphisms (SNPs) typically ranges between 500,000 and 1,000,000. Accordingly, detecting gene-gene interactions in GWAS is computationally challenging because it involves hundreds of billions of SNP pairs. Stage-wise strategies are often used to overcome the computational difficulty. In the first stage, fast screening methods (e.g. Tuning ReliefF) are applied to reduce the whole SNP set to a small subset. In the second stage, sophisticated modeling methods (e.g., multifactor-dimensionality reduction (MDR)) are applied to the subset of SNPs to identify interesting interaction models and the corresponding interaction patterns. In the third stage, the significance of the identified interaction patterns is evaluated by hypothesis testing.
Results: In this paper, we show that this stage-wise strategy could be problematic in controlling the false positive rate if the null distribution is not appropriately chosen. This is because screening and modeling may change the null distribution used in hypothesis testing. In our simulation study, we use some popular screening methods and the popular modeling method MDR as examples to show the effect of the inappropriate choice of null distributions. To choose appropriate null distributions, we suggest to use the permutation test or testing on the independent data set. We demonstrate their performance using synthetic data and a real genome wide data set from an Aged-related Macular Degeneration (AMD) study.
Conclusions: The permutation test or testing on the independent data set can help choosing appropriate null distributions in hypothesis testing, which provides more reliable results in practice.
Figures
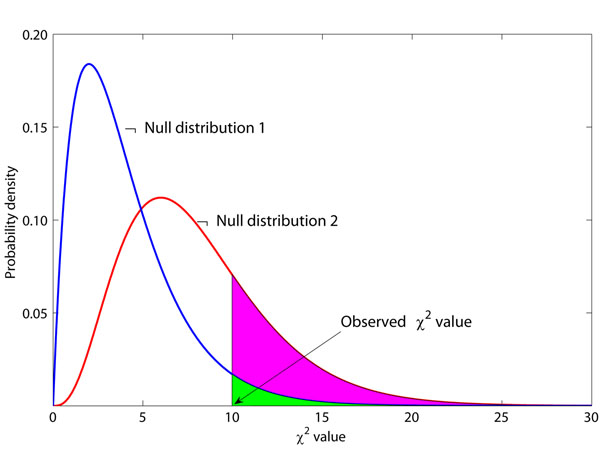
 and null distribution 2 follows the
  . The observed χ2 value is 10, and the P-values are 0.0404 and 0.2650 for these two null distributions, respectively. Suppose P = 0.05 is the threshold of hypothesis testing. Then P = 0.0404 indicates a significant result, while P = 0.2650 does not. If the true null distribution is , then the use of will give many false positive results.
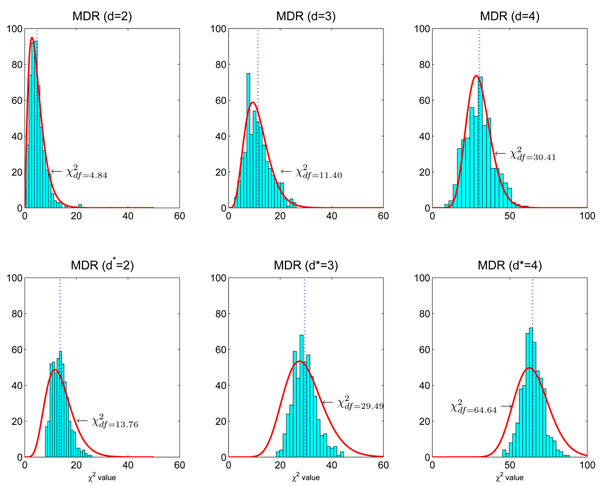

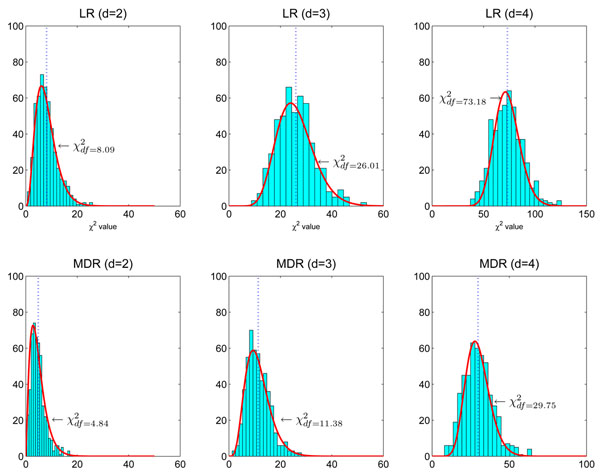
 Here df = 73.18 is smaller than the theoretical one (df = 80) because there are only about 666 samples in hypothesis testing. The number of samples is too small to accurately estimate the large degree of freedom of the theoretical null distribution (df = 80). The lower panel: MDR is used in modeling. We can see that the obtained null distributions are roughly the same with those shown in the upper panel of Figure 2.

References
Publication types
MeSH terms
LinkOut - more resources
Full Text Sources
