. 2011 Feb 15;12 Suppl 1(Suppl 1):S50.
doi: 10.1186/1471-2105-12-S1-S50.

A regression analysis of gene expression in ES cells reveals two gene classes that are significantly different in epigenetic patterns

Affiliations

A regression analysis of gene expression in ES cells reveals two gene classes that are significantly different in epigenetic patterns

Sung-Joon Park et al. BMC Bioinformatics. .

Abstract

Background: To understand the gene regulatory system that governs the self-renewal and pluripotency of embryonic stem cells (ESCs) is an important step for promoting regenerative medicine. In it, the role of several core transcription factors (TFs), such as Oct4, Sox2 and Nanog, has been intensively investigated, details of their involvement in the genome-wide gene regulation are still not well clarified.

Methods: We constructed a predictive model of genome-wide gene expression in mouse ESCs from publicly available ChIP-seq data of 12 core TFs. The tag sequences were remapped on the genome by various alignment tools. Then, the binding density of each TF is calculated from the genome-wide bona fide TF binding sites. The TF-binding data was combined with the data of several epigenetic states (DNA methylation, several histone modifications, and CpG island) of promoter regions. These data as well as the ordinary peak intensity data were used as predictors of a simple linear regression model that predicts absolute gene expression. We also developed a pipeline for analyzing the effects of predictors and their interactions.

Results: Through our analysis, we identified two classes of genes that are either well explained or inefficiently explained by our model. The latter class seems to be genes that are not directly regulated by the core TFs. The regulatory regions of these gene classes show apparently distinct patterns of DNA methylation, histone modifications, existence of CpG islands, and gene ontology terms, suggesting the relative importance of epigenetic effects. Furthermore, we identified statistically significant TF interactions correlated with the epigenetic modification patterns.

Conclusions: Here, we proposed an improved prediction method in explaining the ESC-specific gene expression. Our study implies that the majority of genes are more or less directly regulated by the core TFs. In addition, our result is consistent with the general idea of relative importance of epigenetic effects in ESCs.


Figures

Figure 1
Figure 1
Schematic representation of ChIP-seq data analysis and examples of TF-binding density profiles. (A) Definitions of a peak region and its intensity. (B) Example of intensity correlation between the original data and the reanalyzed data. (C) Density estimation from the genome-wide binding locations of a TF. (D)-(E) Example of density profiles in five peak datasets.
Figure 2
Figure 2
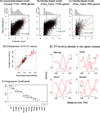
Predictive results of density-based linear regression model. (A)-(C) Average correlation coefficient of 10-fold CV in three gene sets. (D) Comparative analysis of two models using ESC-specific gene subsets that co-bound by pluripotent TF pairs. Red solid circles are the cases that the density profiles of a TF pair are significantly different. (E) Distinct binding profiles in two gene classes that are either well explained (C1) or inefficiently explained (C2). (F) Contribution of each TF and epigenetic effects in density-based regression models (Methy: DNA methylation, HistM: histone mark, CpGI: CpG Island).
Figure 3
Figure 3
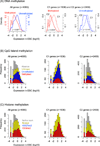
Epigenetic modifications in ESC-specific genes. Three epigenetic states observed in genes whose expressions are 4-fold up or down in ESC against EB are considered. Gene class C1 and C2 are well explained and inefficiently explained genes by the regression analysis, respectively.
Figure 4
Figure 4
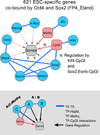
Example of regulatory network of TF interactions with epigenetic effects. This network was generated by the connectivity of nodes in all interaction terms. For example, an interaction term A:B:C is split into three interactions, A:B, A:C, and B:C. Then, the nodes are linked to each other and to the target gene set. A pairwise interaction with an epigenetic effect is treated differently. For example, in the case of B:Methy, B is not linked to the target gene set.

Similar articles

Cited by

References

    1. Evans MJ, Kaufman MH. Establishment in culture of pluripotential cells from mouse embryos. Nature. 1981;292(5819):154–6. doi: 10.1038/292154a0. - DOI - PubMed
    1. Martin GR. Isolation of a pluripotent cell line from early mouse embryos cultured in medium conditioned by teratocarcinoma stem cells. Proc Natl Acad Sci USA. 1981;78(12):7634–8. doi: 10.1073/pnas.78.12.7634. - DOI - PMC - PubMed
    1. Thomson JA, Itskovitz-Eldor J, Shapiro SS, Waknitz MA, Swiergiel JJ, Marshall VS, Jones JM. Embryonic stem cell lines derived from human blastocysts. Science. 1998;282(5391):1145–7. doi: 10.1126/science.282.5391.1145. - DOI - PubMed
    1. Greber B, Lehrach H, Adjaye J. Silencing of core transcription factors in human EC cells highlights the importance of autocrine FGF signaling for self-renewal. BMC Dev Biol. 2007;7:46. doi: 10.1186/1471-213X-7-46. - DOI - PMC - PubMed
    1. Silva J, Smith A. Capturing pluripotency. Cell. 2008;132(4):532–6. doi: 10.1016/j.cell.2008.02.006. - DOI - PMC - PubMed

Publication types

Substances