. 2011 May 11;51(9):1039-46.
doi: 10.1016/j.visres.2011.02.016. Epub 2011 Feb 20.

Accommodative lag and juvenile-onset myopia progression in children wearing refractive correction

Collaborators, Affiliations

Accommodative lag and juvenile-onset myopia progression in children wearing refractive correction

David A Berntsen et al. Vision Res. .

Abstract

The relationship between accommodative lag and annual myopia progression was investigated using linear models in 592 myopic children wearing a full refractive correction in the Collaborative Longitudinal Evaluation of Ethnicity and Refractive Error (CLEERE) Study. The mean (± SD) age and spherical equivalent refractive error at baseline were 10.4 ± 1.8 years and -2.13 ± 1.24 D, respectively. The mean annual progression of myopia was -0.45 ± 0.32 D, and the mean accommodative lag (for a 4-D Badal stimulus) was 1.59 ± 0.63 D. Neither lag at the beginning nor at the end of a yearly progression interval was associated with annual myopia progression (all p ≥ 0.12). These data suggest that foveal hyperopic retinal blur during near viewing may not drive juvenile-onset myopia progression.


Figures

Figure 1
Figure 1
Histogram displaying the distribution of cycloplegic, spherical equivalent refractive error at the beginning of each yearly progression interval. (Note: Children with more than one year of progression data are represented more than once.)
Figure 2
Figure 2
Histogram showing the distribution of accommodative lag for the 520 children who contributed data to the “Lag Before” model.
Figure 3
Figure 3
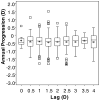
Box plots of the annual change in spherical equivalent refractive error by the amount of accommodative lag for a 4-D Badal stimulus (rounded to the nearest 0.5 D) for the “Lag Before” model. Upper and lower box boundaries represent the 75th and 25th percentiles, respectively. Within each box, the horizontal line represents the median, and the asterisk represents the mean. The upper and lower whiskers mark the most extreme observations within 1.5 interquartile range units above the 75th and below the 25th percentile, respectively, and square symbols represent those observations falling outside of this range.
Figure 4
Figure 4
Box plots of the annual change in spherical equivalent refractive error by age in years. (Note: Children with more than one year of progression data are included in more than one age bin.) Upper and lower box boundaries represent the 75th and 25th percentiles, respectively. Within each box, the horizontal line represents the median, and the asterisk represents the mean. The upper and lower whiskers mark the most extreme observations within 1.5 interquartile range units above the 75th and below the 25th percentile, respectively, and square symbols represent those observations falling outside of this range.
Figure 5
Figure 5
Histogram showing the distribution of accommodative lag for the 572 children who contributed data to the “Lag After” model.
Figure 6
Figure 6
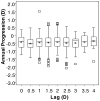
Box plots of the annual change in spherical equivalent refractive error by the amount of accommodative lag for a 4-D Badal stimulus (rounded to the nearest 0.5 D) for the “Lag After” model. Upper and lower box boundaries represent the 75th and 25th percentiles, respectively. Within each box, the horizontal line represents the median, and the asterisk represents the mean. The upper and lower whiskers mark the most extreme observations within 1.5 interquartile range units above the 75th and below the 25th percentile, respectively, and square symbols represent those observations falling outside of this range.

Similar articles

Cited by

References

    1. Abbott ML, Schmid KL, Strang NC. Differences in the accommodation stimulus response curves of adult myopes and emmetropes. Ophthalmic Physiol Opt. 1998;18(1):13–20. - PubMed
    1. Adler D, Millodot M. The possible effect of undercorrection on myopic progression in children. Clin Exp Optom. 2006;89(5):315–321. - PubMed
    1. Allen PM, O’Leary DJ. Accommodation functions: co-dependency and relationship to refractive error. Vision Res. 2006;46(4):491–505. - PubMed
    1. Anderson HA, Glasser A, Stuebing KK, Manny RE. Minus lens stimulated accommodative lag as a function of age. Optom Vis Sci. 2009;86(6):685–694. - PMC - PubMed
    1. Atchison DA, Pritchard N, Schmid KL. Peripheral refraction along the horizontal and vertical visual fields in myopia. Vision Res. 2006;46(8–9):1450–1458. - PubMed

Publication types