. 2011 May 1;203(9):1264-73.
doi: 10.1093/infdis/jir010. Epub 2011 Feb 21.

Designed reduction of Streptococcus pneumoniae pathogenicity via synthetic changes in virulence factor codon-pair bias

Affiliations

Designed reduction of Streptococcus pneumoniae pathogenicity via synthetic changes in virulence factor codon-pair bias

J Robert Coleman et al. J Infect Dis. .

Abstract

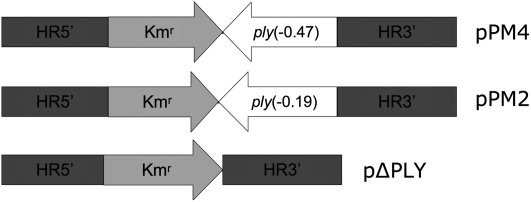
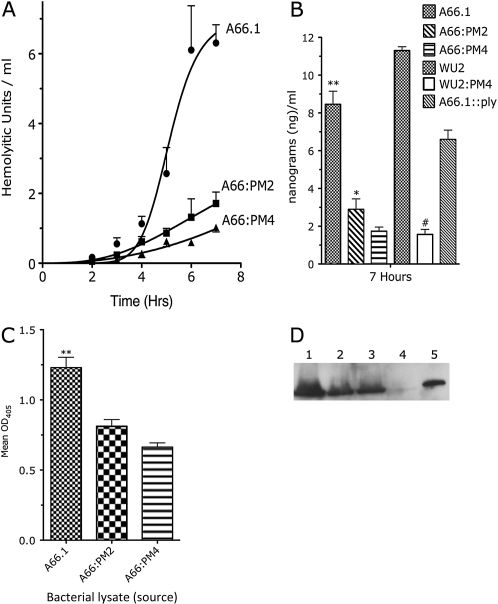
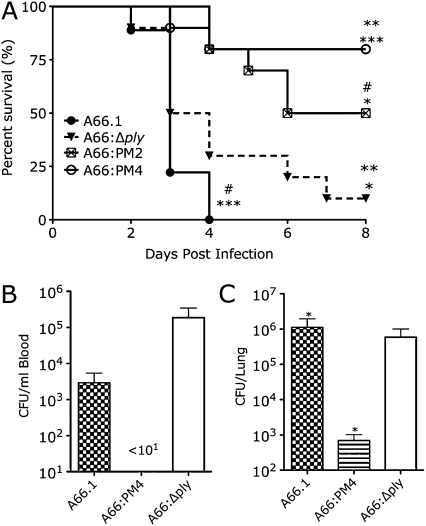
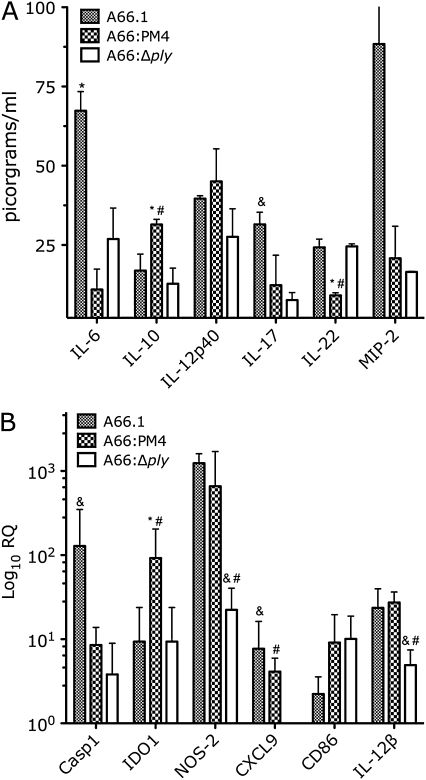
In this study, we used a previously described method of controlling gene expression with computer-based gene design and de novo DNA synthesis to attenuate the virulence of Streptococcus pneumoniae. We produced 2 S. pneumoniae serotype 3 (SP3) strains in which the pneumolysin gene (ply) was recoded with underrepresented codon pairs while retaining its amino acid sequence and determined their ply expression and pneumolysin production in vitro and their virulence in a mouse pulmonary infection model. Expression of ply and production of pneumolysin of the recoded SP3 strains were decreased, and the recoded SP3 strains were less virulent in mice than the wild-type SP3 strain or a Δply SP3 strain. Further studies showed that the least virulent recoded strain induced a markedly reduced inflammatory response in the lungs compared with the wild-type or Δply strain. These findings suggest that reducing pneumococcal virulence gene expression by altering codon-pair bias could hold promise for rational design of live-attenuated pneumococcal vaccines.


Figures

Figure 1.
Figure 1.
Synthetic constructs for genomic integration of designed pneumolysin genes (ply) of Streptococcus pneumoniae. Synthetic DNA constructs used for transformation and recombination were inserted in plasmids designated pPM4, pPM2, and pΔPLY (Table 1). HR5′ and HR3′ are 800-bp sequences identically homologous to genomic regions (noncoding) of the wild-type ply locus, thus allowing for efficient recombination. The Kmr region is a kanamycin resistance cassette and remained in all strains.
Figure 2.
Figure 2.
Hemolytic activity and quantification of pneumolysin (PLY) produced by wild-type, ply-deleted, and ply-recoded Streptococcus pneumoniae serotype 3 strains. A, Hemolytic activity of PLY in the supernatant of growing S. pneumoniae strains measured over time. *P < .003 (1-way analysis of variance). All strains had similar growth kinetics. B, Concentration of PLY in growth media of the indicated strains 7 h after initiation of the culture, calculated from hemolytic units as described elsewhere [22]. *P < .001 comparing A66.1 and A66:PM4; *P < .002 comparing A66.1 and A66:PM2; **P < .004 comparing A66:PM2 and A66:PM4; #P < .001 comparing WU2 and WU2:PM4 (Student unpaired t test of 4–5 independent experiments). C, Total amount of PLY produced in vitro as measured by enzyme-linked immunosorbent assay from stationary phase cultures. *P < .01 comparing A66.1 and A66:PM4; *P < .04 comparing A66.1 and A66.1:PM2; **P = .051 comparing A66:PM2 and A66:PM4 (Student unpaired t test. D, Western blot of total PLY produced after in vitro growth reached the stationary phase. Lane 1, A66.1; lane 2, A66:PM2; lane 3, A66:PM4; lane 4, A66:Δply; lane 5, purified PLY (500 ng). All bands indicate similar molecular weights (52 kDa). OD405, optical density at 405 nm.
Figure 3.
Figure 3.
Survival and bacterial burden of mice infected with wild-type, pneumolysin gene (ply)–deleted, and ply-recoded Streptococcus pneumoniae serotype 3 (SP3) strains. A. Survival of BALB/c mice after intranasal infection with 5 × 10⁴ colony-forming units (CFUs) of wild-type, ply-recoded, and ply-deleted SP3 A66.1 strains. **P < .001 comparing A66.PM4 and A66.1; **P < .002 comparing A66:PM4 and A66:Δply; *P < .02 comparing A66:PM2 and A66:Δply; *P < .001 comparing A66:PM2 and A66.1 (Kaplan-Meier log-rank test; curves depict results of 2 independent experiments with 5 mice per group; n = 10). B, CFUs in lungs of mice infected as in panel A, 48 h after infection. *P < .05 comparing A66.1 and A66:PM4; *P < .05 comparing A66.1 and A66:Δply (Student unpaired t test). C, CFUs in blood of mice infected as in panel A, 48 h after infection. No S. pneumoniae was detected in the blood of mice infected with A66:PM4 (lower limit of detection, 101). For panels B and C, bars represent the mean and error bars represent the standard deviation (n = 3).
Figure 4.
Figure 4.
Cellular profiles of the lungs of mice infected with wild-type, pneumolysin gene (ply)–deleted, and ply-recoded Streptococcus pneumoniae serotype 3 strains, showing flow cytometric characterization of the indicated cells in the lungs of BALB/c mice 48 h after infection with 5 × 10⁴ colony-forming units of the indicated strains or TSB. A, CD45+CD3+CD4+ T cells. *P < .001 comparing A66:PM4 and A66.1; *P < .02 comparing A66:PM4 and A66:Δply (Student unpaired t test; n = 3). B, CD45+CD3+CD8+ T cells. *P < .02 comparing A66:PM4 and A66.1; *P < .02 comparing A66:PM4 and A66:Δply (Student unpaired t test; n = 3). C, CD45+CD19+ B cells. *P < .001 comparing A66:PM4 and A66.1. D, CD45+Ly6G+ cells. *P < .02 comparing A66:PM4 and A66.1; **P < .01 comparing A66.1 and A66:Δply (Student unpaired t test; n = 6). Bars represent the mean and error bars represent the standard deviation.
Figure 5.
Figure 5.
Effect of wild-type, pneumolysin gene (ply)–deleted, and ply-recoded Streptococcus pneumoniae serotype 3 (SP3) strains on cytokine levels in the lungs of infected mice and lung dendritic cell (DC) gene expression in vitro. A, Concentration of the indicated cytokines in the lungs of BALB/c mice 48 h after infection with 5 × 10⁴ colony-forming units of the indicated SP3 strains (n = 3). *P = .054 comparing macrophage inflammatory protein 2 (MIP-2) levels for A66.1 and A66:Δply (Student t test); *P < .04 comparing A66.1 and A66:PM4; #P < .04 comparing A66:PM4 and A66:Δply; &P < .04 comparing A66.1 and A66:Δply (Student t test). B, RNA levels of indicated genes in naïve lung DCs stimulated with the indicated SP3 strains as described in the text, expressed as logarithmic relative quantification (RQ) relative to naïve DCs from mouse lungs (n = 4–8). *P < .04 comparing A66.1 and A66:PM4; #P < .04 comparing A66:PM4 and A66:Δply; &P < .04 comparing A66.1 and A66:Δply (Mann-Whitney test). Casp1, apoptosis-related cysteine peptidase; IDO1, indoleamine 2,3-dioxygenase 1; IL-6, interleukin 6; IL-10, interleukin 10; IL-12β, interleukin 12 β; IL-12p40, interleukin 12p40; IL-17, interleukin 17; IL-22, interleukin 22; NOS2, nitric oxide synthase 2.
Figure 6.
Figure 6.
Antibody titers in serum samples of surviving A66:PM4-infected mice and their survival following challenge with A66.1. A, Serum levels of immunoglobulin G (IgG) and immunoglobulin M (IgM) to whole wild-type (Wt) A66.1 determined by whole-cell enzyme-linked immunosorbent assay (ELISA). *P < .001 comparing A66:PM4-infected surviving mice and uninfected mice (Student t test). B, Serum levels of IgG to pneumococcal capsular polysaccharide determined by ELISA. *P < .05 comparing A66:PM4-infected surviving mice and uninfected mice (Student t test). C, Serum levels of IgG to pneumolysin determined by ELSIA. *P < .001 comparing A66:PM4-infected surviving mice and uninfected mice (Student t test). D, Survival of surviving A66:PM4-infected mice challenged with wild-type A66.1 42 d after primary infection. *P < .003 comparing A66:PM4-infected and challenged mice and naïve mice (Kaplan-Meier test; n = 5). For panels A, B, and C, n = 5, bars represent the mean and error bars represent the standard deviation (n = 5).

References

    1. Coleman JR, Papamichail D, Skiena S, Futcher B, Wimmer E, Mueller S. Virus attenuation by genome-scale changes in codon pair bias. Science. 2008;320:1784–7. - PMC - PubMed
    1. Gutman GA, Hatfield GW. Nonrandom utilization of codon pairs in Escherichia coli. Proc Natl Acad Sci U S A. 1989;86:3699–703. - PMC - PubMed
    1. Gouy M, Gautier C. Codon usage in bacteria: correlation with gene expressivity. Nucleic Acids Res. 1982;10:7055–74. - PMC - PubMed
    1. Ikemura T. Codon usage and tRNA content in unicellular and multicellular organisms. Mol Biol Evol. 1985;2:13–34. - PubMed
    1. Tats A, Tenson T, Remm M. Preferred and avoided codon pairs in three domains of life. BMC Genomics. 2008;9:463. - PMC - PubMed

Publication types

MeSH terms