. 2011 Apr;17(4):761-72.
doi: 10.1261/rna.2581711. Epub 2011 Feb 22.

Complex and dynamic landscape of RNA polyadenylation revealed by PAS-Seq

Affiliations

Complex and dynamic landscape of RNA polyadenylation revealed by PAS-Seq

Peter J Shepard et al. RNA. 2011 Apr.

Abstract

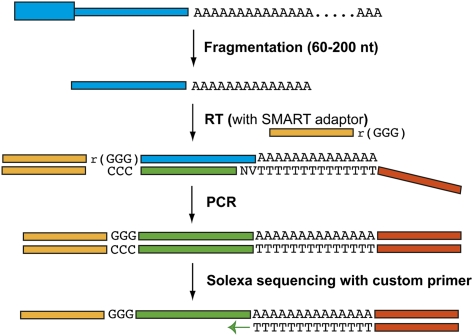
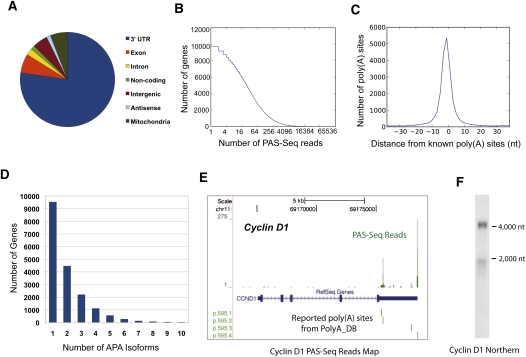
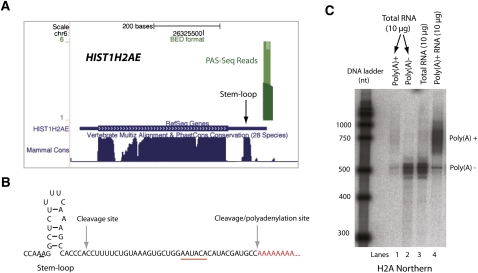
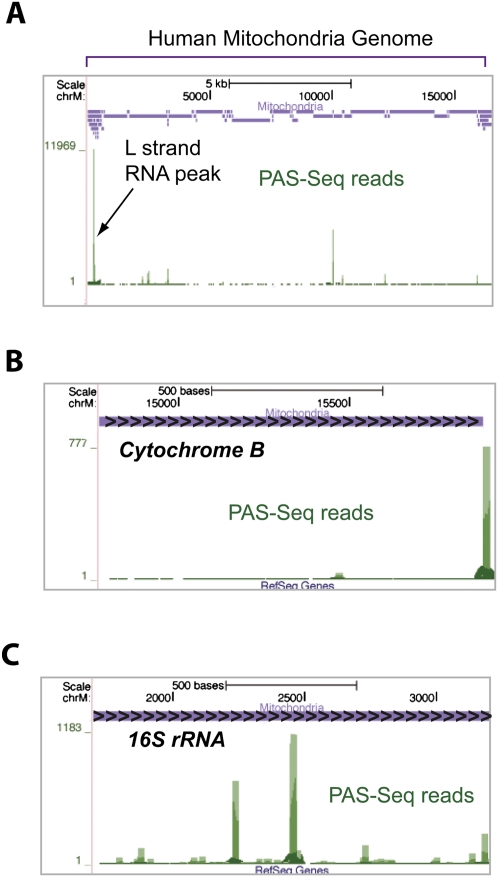
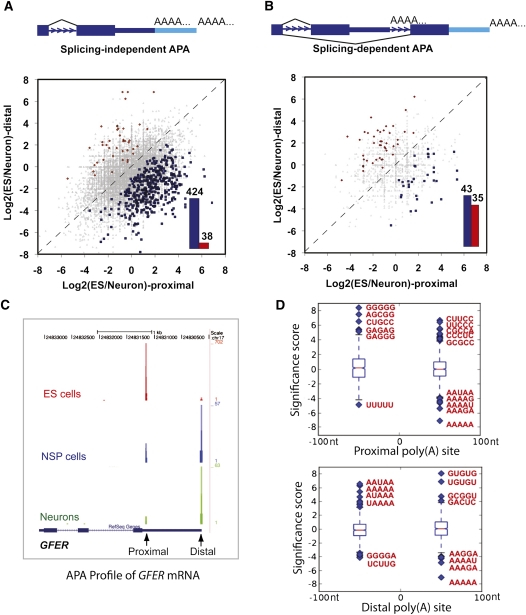
Alternative polyadenylation (APA) of mRNAs has emerged as an important mechanism for post-transcriptional gene regulation in higher eukaryotes. Although microarrays have recently been used to characterize APA globally, they have a number of serious limitations that prevents comprehensive and highly quantitative analysis. To better characterize APA and its regulation, we have developed a deep sequencing-based method called Poly(A) Site Sequencing (PAS-Seq) for quantitatively profiling RNA polyadenylation at the transcriptome level. PAS-Seq not only accurately and comprehensively identifies poly(A) junctions in mRNAs and noncoding RNAs, but also provides quantitative information on the relative abundance of polyadenylated RNAs. PAS-Seq analyses of human and mouse transcriptomes showed that 40%-50% of all expressed genes produce alternatively polyadenylated mRNAs. Furthermore, our study detected evolutionarily conserved polyadenylation of histone mRNAs and revealed novel features of mitochondrial RNA polyadenylation. Finally, PAS-Seq analyses of mouse embryonic stem (ES) cells, neural stem/progenitor (NSP) cells, and neurons not only identified more poly(A) sites than what was found in the entire mouse EST database, but also detected significant changes in the global APA profile that lead to lengthening of 3' untranslated regions (UTR) in many mRNAs during stem cell differentiation. Together, our PAS-Seq analyses revealed a complex landscape of RNA polyadenylation in mammalian cells and the dynamic regulation of APA during stem cell differentiation.


Figures

FIGURE 1.
FIGURE 1.
PAS-Seq. The procedure of PAS-Seq is described in detail in text. The blue boxes represent RNAs and orange, yellow, and green boxes represent linkers and cDNAs. Two degenerate nucleotides are present in the anchored oligo(dT) primer; “V” represents A/C/G and “N” represents A/T/C/G.
FIGURE 2.
FIGURE 2.
PAS-Seq analyses of HeLa cell transcriptome. (A) A pie chart showing the distribution of HeLa PAS-Seq reads mapping result. “Exon” represents exonic regions excluding 3′ UTRs. (B) The depth of PAS-Seq analyses of HeLa transcriptome. Y-axis: the number of genes. X-axis: the number of reads detected in log2 scale. (C) Comparison between PAS-Seq-identified vs. known poly(A) sites. Y-axis: the number of poly(A) sites. X-axis: the distance between PAS-Seq-identified and the nearest known poly(A) sites. (D) A bar graph showing the number of genes with different number of poly(A) sites detected and at least 2 PAS-Seq reads are required per poly(A) site. Each number “n” on the x-axis means n or more APA isoforms were detected. (E) PAS-Seq mapping results for cyclin D1 transcripts. The green bars above “RefSeq Gene” are the PAS-Seq reads shown in BED format. The green lines below “RefSeq” mark the known poly(A) sites found in polyA_DB. (F) Northern blot for cyclin D1. Size markers are labeled.
FIGURE 3.
FIGURE 3.
Polyadenylated histone mRNAs. (A) PAS-Seq mapping results for HIST1H2AE. The green bar above the RefSeq Gene represents PAS-Seq reads. The sequence conservation levels among mammals are shown below the RefSeq Gene. The position of the stem–loop sequence is marked. (B) A diagram of HIST1H2AE 3′-UTR stem–loop structure, normal cleavage site, and cleavage/polyadenylation site detected by 3′-RACE. (C) Northern blot of H2A. Lanes 1 and 2 are polyA+ and polyA− RNAs isolated from 10 μg of HeLa total RNA.
FIGURE 4.
FIGURE 4.
A human mitochondria RNA polyadenylation map. (A) PAS-Seq mapping results on the entire mitochondrial genome. A custom track (purple) shows the positions of all human mitochondrial genes. The green bars represent PAS-Seq reads and the peak corresponding to the polyadenylated L strand transcripts is marked. (B) PAS-Seq mapping results on the cytochrome B gene. Overlapping PAS-Seq reads appear as a continuous line covering the majority of the gene. (C) PAS-Seq mapping results on the 16S rRNA gene.
FIGURE 5.
FIGURE 5.
Dynamic APA landscape during stem cell differentiation. (A) Splicing-independent APA changes between ES and neurons. Y-axis: ratio of PAS-Seq reads counts between ES and neurons for the distal poly(A) sites in log2 scale. X-axis: ratio of PAS-Seq reads counts between ES and neurons for the proximal poly(A) sites in log2 scale. APA events with statistically significant change (P < 0.05 by Fisher Exact Test) are colored in red (distal sites preferentially used in ES) or blue (proximal sites preferentially used in ES). Bar graph shows the number of red or blue data points in the scatter plot. (B) Splicing-dependent APA changes between ES and neurons. (C) PAS-Seq reads mapping results for the GFER gene in ES, NSP, and neurons. Proximal and distal sites are marked. (D) Box plots showing over- and underrepresented motifs at the regulated proximal and distal poly(A) sites. The sequences of the most over- and underrepresented motifs (Z score >5) are shown in red.

References

    1. Arhin GK, Boots M, Bagga PS, Milcarek C, Wilusz J 2002. Downstream sequence elements with different affinities for the hnRNP H/H′ protein influence the processing efficiency of mammalian polyadenylation signals. Nucleic Acids Res 30: 1842–1850 - PMC - PubMed
    1. Beaudoing E, Freier S, Wyatt JR, Claverie JM, Gautheret D 2000. Patterns of variant polyadenylation signal usage in human genes. Genome Res 10: 1001–1010 - PMC - PubMed
    1. Bentley DL 2005. Rules of engagement: co-transcriptional recruitment of pre-mRNA processing factors. Curr Opin Cell Biol 17: 251–256 - PubMed
    1. Blum E, Carpousis AJ, Higgins CF 1999. Polyadenylation promotes degradation of 3′-structured RNA by the Escherichia coli mRNA degradosome in vitro. J Biol Chem 274: 4009–4016 - PubMed
    1. Castillo-Davis CI, Hartl DL 2003. GeneMerge–post-genomic analysis, data mining, and hypothesis testing. Bioinformatics 19: 891–892 - PubMed

Publication types