. 2011 May;55(5):2310-8.
doi: 10.1128/AAC.01167-10. Epub 2011 Feb 22.

Differential drug efflux or accumulation does not explain variation in the chloroquine response of Plasmodium falciparum strains expressing the same isoform of mutant PfCRT

Affiliations

Differential drug efflux or accumulation does not explain variation in the chloroquine response of Plasmodium falciparum strains expressing the same isoform of mutant PfCRT

Adele M Lehane et al. Antimicrob Agents Chemother. 2011 May.

Abstract

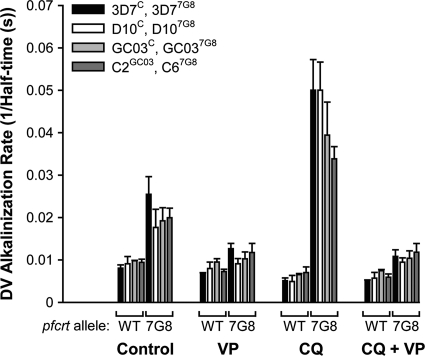
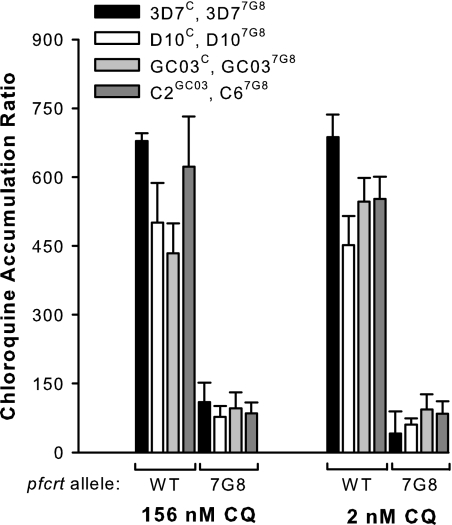
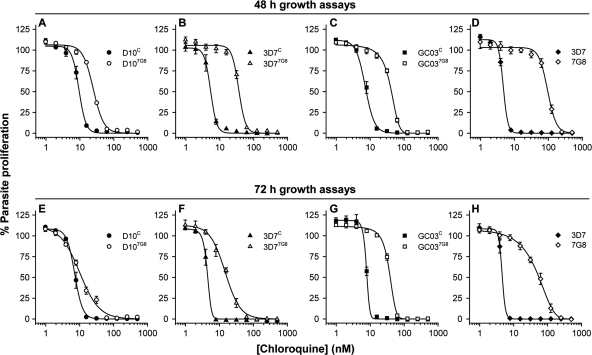
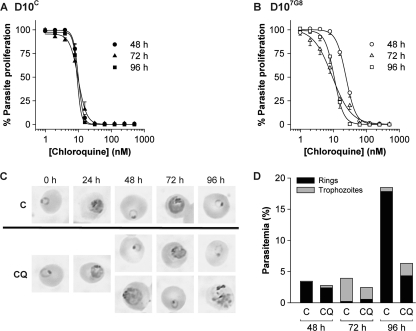
Mutant forms of the Plasmodium falciparum chloroquine resistance transporter (PfCRT) mediate chloroquine resistance by effluxing the drug from the parasite's digestive vacuole, the acidic organelle in which chloroquine exerts its parasiticidal effect. However, different parasites bearing the same mutant form of PfCRT can vary substantially in their chloroquine susceptibility. Here, we have investigated the biochemical basis for the difference in chloroquine response among transfectant parasite lines having different genetic backgrounds but bearing the same mutant form of PfCRT. Despite showing significant differences in their chloroquine susceptibility, all lines with the mutant PfCRT showed a similar chloroquine-induced H+ leak from the digestive vacuole, indicative of similar rates of PfCRT-mediated chloroquine efflux. Furthermore, all lines showed similarly reduced levels of drug accumulation. Factors other than chloroquine efflux and accumulation therefore influence the susceptibility to this drug in parasites expressing mutant PfCRT. Furthermore, in some but not all strains bearing mutant PfCRT, the 50% inhibitory concentration (IC50) for chloroquine and the degree of resistance compared to that of recombinant control parasites varied with the length of the parasite growth assays. In these parasites, the 50% inhibitory concentration for chloroquine measured in 72- or 96-h assays was significantly lower than that measured in 48-h assays. This highlights the importance of considering the first- and second-cycle activities of chloroquine in future studies of parasite susceptibility to this drug.


Figures

Fig. 1.
Fig. 1.
Alkalinization of the DV by the V-type H+-ATPase inhibitor concanamycin A. (A and B) Representative fluorometer traces showing the alkalinization of the DV following the addition of concanamycin A (100 nM, at the point indicated by the black triangle) to isolated mature trophozoite-stage CQS D10C (A) and CQR D107G8 (B) parasites suspended in the presence (gray traces) or absence (solvent control; black traces) of 2.5 μM CQ. CQ was added 4 min before the addition of concanamycin A. (C) Effect of increasing external CQ concentrations on the rate of DV alkalinization (expressed as the inverse of the half-time) following H+-ATPase inhibition in the pfcrt-modified clones. CQ was added to saponin-isolated mature trophozoites containing fluorescein-dextran in their DVs 4 min prior to the addition of concanamycin A (100 nM). Data are averaged from at least three separate experiments for each line and are shown as means ± SEM. For clarity, only positive error bars are shown for the 3D7C, 3D77G8, GC03C, and C67G8 lines, and only negative error bars are shown for the D10C, D107G8, and GC037G8 lines. Where not shown, error bars fall within the symbols.
Fig. 2.
Fig. 2.
Effect of verapamil (VP) on the CQ-induced changes in the DV alkalinization rate (expressed as the inverse of the half-time) following H+-ATPase inhibition in the transfectant lines expressing wild-type (WT) PfCRT or 7G8 PfCRT. The data are averaged from three independent experiments (shown as means + SEM) for each line. CQ (2.5 μM) and VP (50 μM) were added to suspensions of isolated fluorescein-dextran-loaded mature trophozoites 4 min before the addition of concanamycin A (100 nM). The relevant solvent controls were performed in each case. Parasite lines were generated by Valderramos et al. (40) (3D7C, 3D77G8, D10C, D107G8, GC03C, and GC037G8) and Sidhu et al. (36) (C2GC03 and C67G8).
Fig. 3.
Fig. 3.
Accumulation of [3H]CQ by erythrocytes infected with mature trophozoite-stage parasites. [3H]CQ accumulation is expressed in terms of the chloroquine accumulation ratio, i.e., the concentration of radiolabeled CQ within the infected cells relative to the concentration in the extracellular medium. The black, white, and light gray bars show data for the parasite lines generated by Valderramos et al. (40) (with the genetic background and pfcrt allele of each line indicated), and the dark gray bars show data for the parasite lines generated by Sidhu et al. (36). The accumulation assays were performed over 1 h at 37°C with [3H]CQ concentrations of 156 nM and 2 nM. The data represent the means (+SEM) of three to five independent experiments for each line.
Fig. 4.
Fig. 4.
The effect of increasing CQ concentrations on parasite proliferation, as assessed using 48-h (A to D) and 72-h (E to H) [3H]hypoxanthine incorporation assays. Data, averaged from 3 to 6 experiments and shown as means ± SEM, are presented for the D10C and D107G8 lines (A and E), the 3D7C and 3D77G8 lines (B and F), the GC03C and GC037G8 lines (C and G), and the nontransfectant 3D7 and 7G8 lines (D and H). Data for lines expressing 7G8 PfCRT and wild-type PfCRT are shown with open symbols and closed symbols, respectively. Where not shown, error bars fall within the symbols.
Fig. 5.
Fig. 5.
The effect of increasing CQ concentrations on parasite proliferation in D10C (A) and D107G8 (B) parasites, as assessed using 48-h (circles), 72-h (triangles), and 96-h (squares) [3H]hypoxanthine incorporation assays. Data are averaged from four independent experiments and are shown as means ± SEM. For clarity, only positive error bars are shown for D10C, and only negative error bars are shown for D107G8. Where not shown, error bars fall within the symbols. (C) Giemsa-stained smears of untreated (control [“C”]) D107G8 parasites (top) and of D107G8 parasites treated with 15 nM CQ (bottom) at various time points following the start of CQ exposure. Where two photos are shown for one time point and condition, they represent parasite stages that were both present in significant numbers. (D) Parasitemias of untreated (“C”) and CQ (15 nM)-treated cells and proportions of ring-stage parasites and trophozoite-stage parasites at the 48-h, 72-h, and 96-h time points in the experiment from which the micrographs in panel C were obtained.

References

    1. Abu Bakar N., Klonis N., Hanssen E., Chan C., Tilley L. 2010. Digestive-vacuole genesis and endocytic processes in the early intraerythrocytic stages of Plasmodium falciparum. J. Cell Sci. 123:441–450 - PubMed
    1. Allen R. J., Kirk K. 2010. Plasmodium falciparum culture: the benefits of shaking. Mol. Biochem. Parasitol. 169:63–65 - PubMed
    1. Becker K., et al. 2004. Oxidative stress in malaria parasite-infected erythrocytes: host-parasite interactions. Int. J. Parasitol. 34:163–189 - PubMed
    1. Bray P. G., et al. 2005. Defining the role of PfCRT in Plasmodium falciparum chloroquine resistance. Mol. Microbiol. 56:323–333 - PubMed
    1. Bray P. G., et al. 2006. PfCRT and the trans-vacuolar proton electrochemical gradient: regulating the access of chloroquine to ferriprotoporphyrin IX. Mol. Microbiol. 62:238–251 - PMC - PubMed

Publication types

MeSH terms

LinkOut - more resources