

Ultrasound molecular imaging of tumor angiogenesis with an integrin targeted microbubble contrast agent
- PMID: 21343825
- PMCID: PMC3075480
- DOI: 10.1097/RLI.0b013e3182034fed
Ultrasound molecular imaging of tumor angiogenesis with an integrin targeted microbubble contrast agent
Abstract
Rationale and objectives: Ultrasound molecular imaging is an emerging technique for sensitive detection of intravascular targets. Molecular imaging of angiogenesis has strong potential for both clinical use and as a research tool in tumor biology and the development of antiangiogenic therapies. Our objectives are to develop a robust ultrasound contrast agent platform using microbubbles (MB) to which targeting ligands can be conjugated by biocompatible, covalent conjugation chemistry, and to develop a pure low mechanical index (MI) imaging processing method and corresponding quantification method. The MB and the imaging methods were evaluated in a mouse model of breast cancer in vivo.
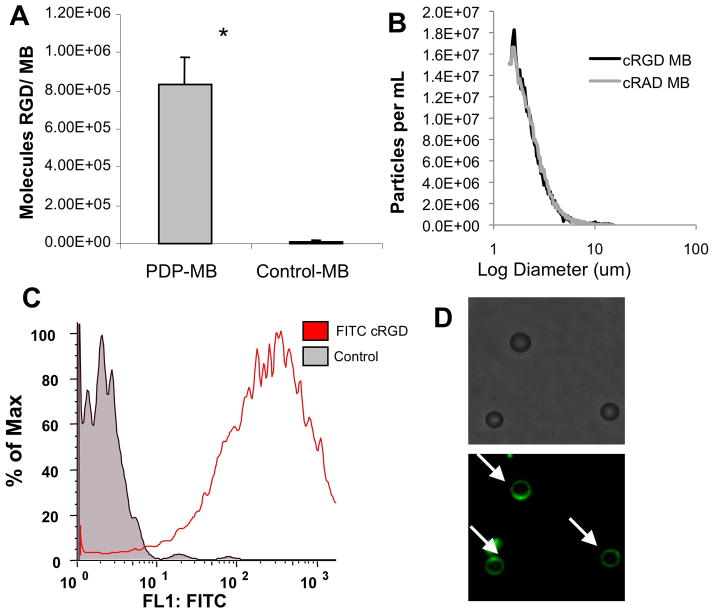
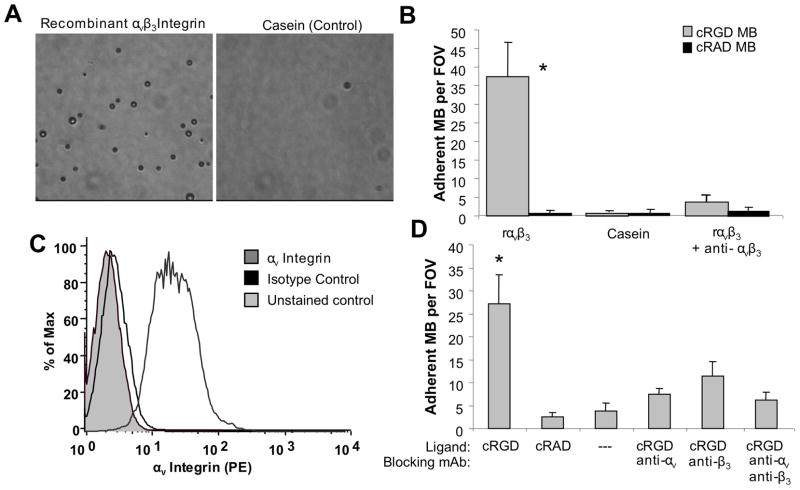
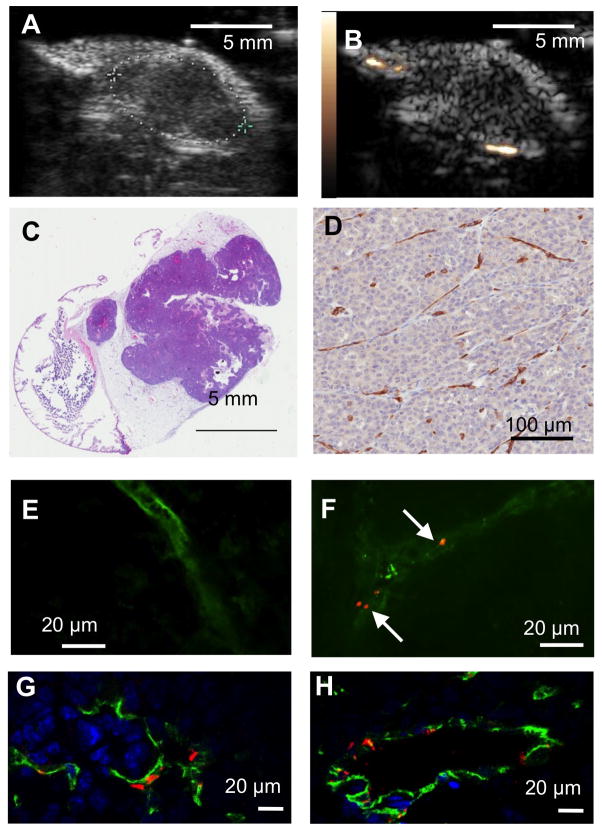
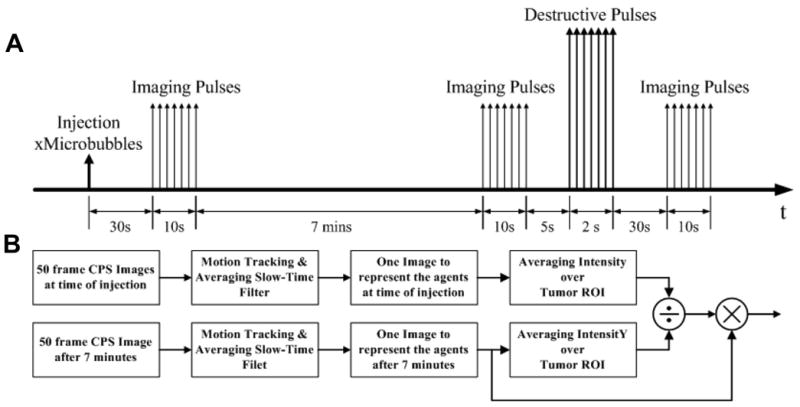
Materials and methods: We used a cyclic arginine-glycine-aspartic acid (cRGD) pentapeptide containing a terminal cysteine group conjugated to the surface of MB bearing pyridyldithio-propionate (PDP) for targeting αvβ3 integrins. As negative controls, MB without a ligand or MB bearing a scrambled sequence (cRAD) were prepared. To enable characterization of peptides bound to MB surfaces, the cRGD peptide was labeled with FITC and detected by plate fluorometry, flow cytometry, and fluorescence microscopy. Targeted adhesion of cRGD-MB was demonstrated in an in vitro flow adhesion assay against recombinant murine αvβ3 integrin protein and αvβ3 integrin-expressing endothelial cells (bEnd.3). The specificity of cRGD-MB for αvβ3 integrin was demonstrated by treating bEnd.3 EC with a blocking antibody. A murine model of mammary carcinoma was used to assess targeted adhesion and ultrasound molecular imaging in vivo. The targeted MB were visualized using a low MI contrast imaging pulse sequence, and quantified by intensity normalization and 2-dimensional Fourier transform analysis.
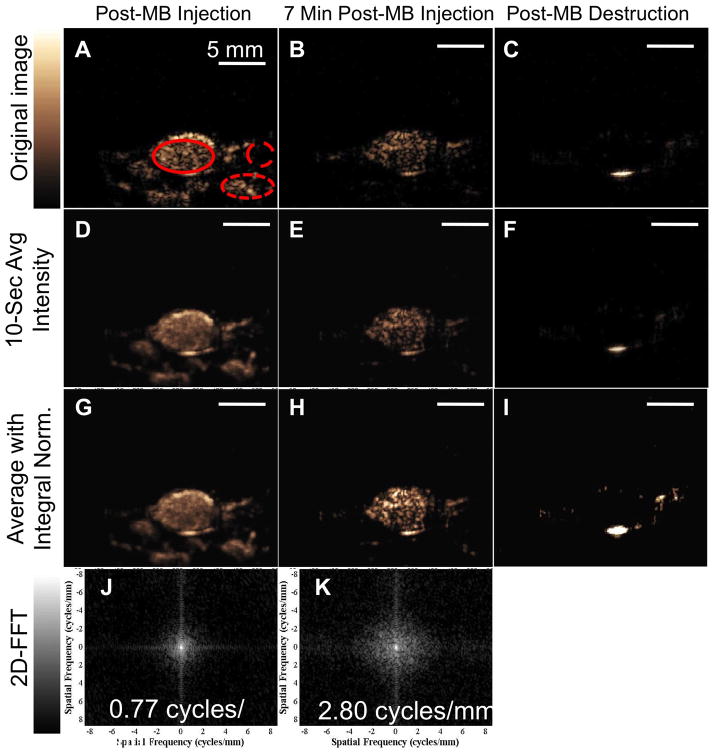
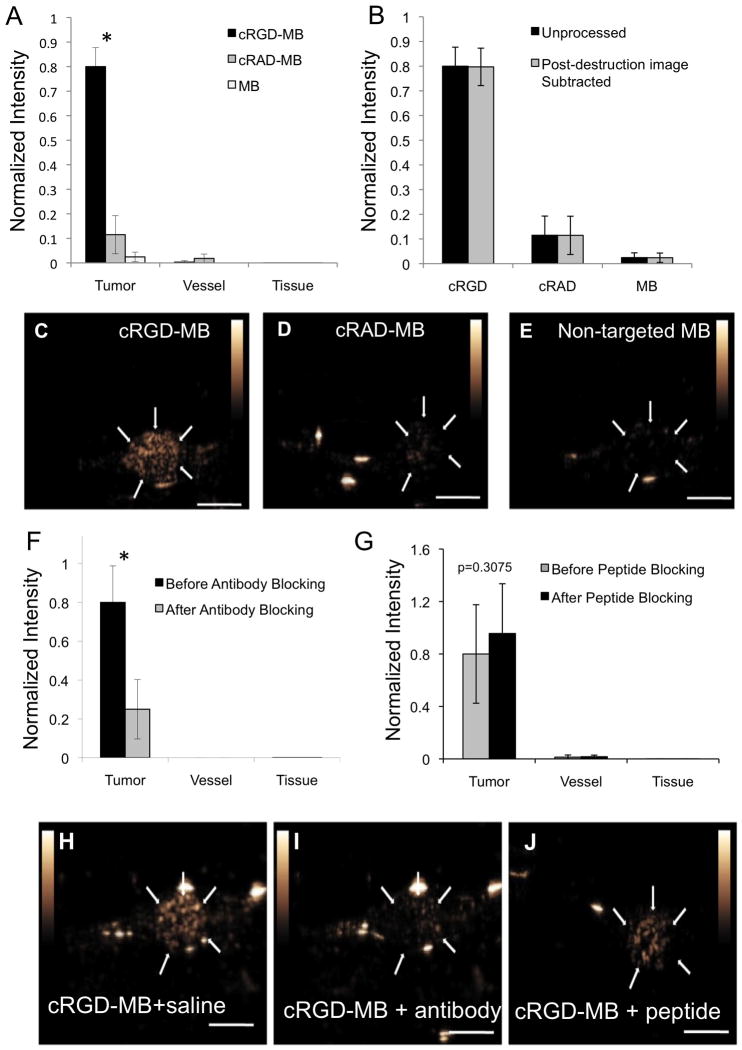
Results: The cRGD ligand concentration on the MB surface was ∼8.2 × 10(6) molecules per MB. At a wall shear stress of 1.0 dynes/cm, cRGD-MB exhibited 5-fold higher adhesion to immobilized recombinant αvβ3 integrin relative to nontargeted MB and cRAD-MB controls. Similarly, cRGD-MB showed significantly greater adhesion to bEnd.3 EC compared with nontargeted MB and cRAD-MB. In addition, cRGD-MB, but not nontargeted MB or cRAD-MB, showed significantly enhanced contrast signals with a high tumor-to-background ratio. The adhesion of cRGD-MB to bEnd.3 was reduced by 80% after using anti-αv monoclonal antibody to treat bEnd.3. The normalized image intensity amplitude was ∼0.8, 7 minutes after the administration of cRGD-MB relative to the intensity amplitude at the time of injection, while the spatial variance in image intensity improved the detection of bound agents. The accumulation of cRGD-MB was blocked by preadministration with an anti-αv blocking antibody.
Conclusions: The results demonstrate the functionality of a novel MB contrast agent covalently coupled to an RGD peptide for ultrasound molecular imaging of αvβ3 integrin and the feasibility of quantitative molecular ultrasound imaging with a low MI.
Figures
References
-
- Carmeliet P, Jain RK. Angiogenesis in cancer and other diseases. Nature. 2000;407:249–57. - PubMed
-
- Stupack DG, Cheresh DA. Apoptotic cues from the extracellular matrix: regulators of angiogenesis. Oncogene. 2003;22:9022–9. - PubMed
-
- Brooks PC, Clark RA, Cheresh DA. Requirement of vascular integrin alpha v beta 3 for angiogenesis. Science. 1994;264:569–571. - PubMed
-
- Brooks PC, Montgomery AM, Rosenfeld M, et al. Integrin alpha v beta 3 antagonists promote tumor regression by inducing apoptosis of angiogenic blood vessels. Cell. 1994;79:1157–64. - PubMed
Publication types
MeSH terms
Substances
Grants and funding
- P30 CA093373/CA/NCI NIH HHS/United States
- R01 CA134659/CA/NCI NIH HHS/United States
- R43 CA137913/CA/NCI NIH HHS/United States
- R01CA112356/CA/NCI NIH HHS/United States
- 1R43CA137913/CA/NCI NIH HHS/United States
- R01CA134659/CA/NCI NIH HHS/United States
- R01 CA103828/CA/NCI NIH HHS/United States
- R01CA103828/CA/NCI NIH HHS/United States
- EB007857/EB/NIBIB NIH HHS/United States
- R43 EB007857/EB/NIBIB NIH HHS/United States
- 2R44EB007857/EB/NIBIB NIH HHS/United States
- R01 CA112356/CA/NCI NIH HHS/United States
- R44 EB007857/EB/NIBIB NIH HHS/United States
LinkOut - more resources
Full Text Sources
Other Literature Sources
Medical
Research Materials
Miscellaneous
