

Conformational changes underlying calcium/calmodulin-dependent protein kinase II activation
- PMID: 21343908
- PMCID: PMC3094114
- DOI: 10.1038/emboj.2011.40
Conformational changes underlying calcium/calmodulin-dependent protein kinase II activation
Abstract
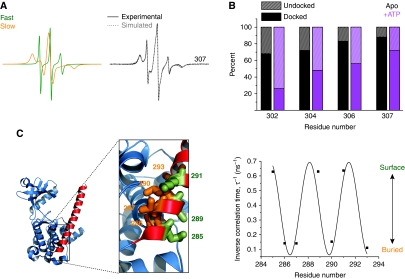
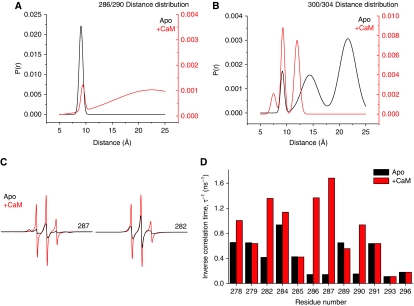
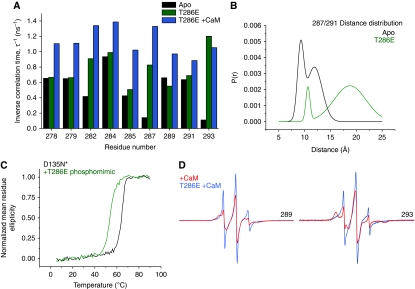
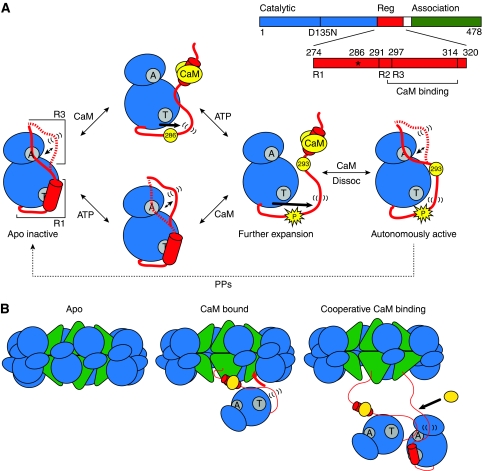
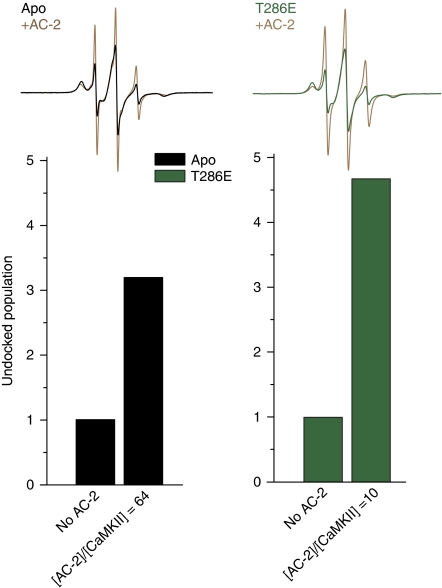
Calcium/calmodulin-dependent protein kinase II (CaMKII) interprets information conveyed by the amplitude and frequency of calcium transients by a controlled transition from an autoinhibited basal intermediate to an autonomously active phosphorylated intermediate (De Koninck and Schulman, 1998). We used spin labelling and electron paramagnetic resonance spectroscopy to elucidate the structural and dynamic bases of autoinhibition and activation of the kinase domain of CaMKII. In contrast to existing models, we find that autoinhibition involves a conformeric equilibrium of the regulatory domain, modulating substrate and nucleotide access. Binding of calmodulin to the regulatory domain induces conformational changes that release the catalytic cleft, activating the kinase and exposing an otherwise inaccessible phosphorylation site, threonine 286. Autophosphorylation at Thr286 further disrupts the interactions between the catalytic and regulatory domains, enhancing the interaction with calmodulin, but maintains the regulatory domain in a dynamic unstructured conformation following dissociation of calmodulin, sustaining activation. These findings support a mechanistic model of the CaMKII holoenzyme grounded in a dynamic understanding of autoregulation that is consistent with a wealth of biochemical and functional data.
Conflict of interest statement
The authors declare that they have no conflict of interest.
Figures

Similar articles
-
Structural analysis and stochastic modelling suggest a mechanism for calmodulin trapping by CaMKII.PLoS One. 2012;7(1):e29406. doi: 10.1371/journal.pone.0029406. Epub 2012 Jan 18. PLoS One. 2012. PMID: 22279535 Free PMC article.
-
Intersubunit capture of regulatory segments is a component of cooperative CaMKII activation.Nat Struct Mol Biol. 2010 Mar;17(3):264-72. doi: 10.1038/nsmb.1751. Epub 2010 Feb 7. Nat Struct Mol Biol. 2010. PMID: 20139983 Free PMC article.
-
Structure of the CaMKIIdelta/calmodulin complex reveals the molecular mechanism of CaMKII kinase activation.PLoS Biol. 2010 Jul 27;8(7):e1000426. doi: 10.1371/journal.pbio.1000426. PLoS Biol. 2010. PMID: 20668654 Free PMC article.
-
Structural Insights into the Regulation of Ca2+/Calmodulin-Dependent Protein Kinase II (CaMKII).Cold Spring Harb Perspect Biol. 2020 Jun 1;12(6):a035147. doi: 10.1101/cshperspect.a035147. Cold Spring Harb Perspect Biol. 2020. PMID: 31653643 Free PMC article. Review.
-
Structural studies on the regulation of Ca2+/calmodulin dependent protein kinase II.Curr Opin Struct Biol. 2013 Apr;23(2):292-301. doi: 10.1016/j.sbi.2013.04.002. Epub 2013 Apr 27. Curr Opin Struct Biol. 2013. PMID: 23632248 Free PMC article. Review.
Cited by
-
Conformational coupling by trans-phosphorylation in calcium calmodulin dependent kinase II.PLoS Comput Biol. 2019 May 31;15(5):e1006796. doi: 10.1371/journal.pcbi.1006796. eCollection 2019 May. PLoS Comput Biol. 2019. PMID: 31150387 Free PMC article.
-
CaMKIIδ Splice Variants in the Healthy and Diseased Heart.Front Cell Dev Biol. 2021 Mar 11;9:644630. doi: 10.3389/fcell.2021.644630. eCollection 2021. Front Cell Dev Biol. 2021. PMID: 33777949 Free PMC article. Review.
-
Architectural Dynamics of CaMKII-Actin Networks.Biophys J. 2019 Jan 8;116(1):104-119. doi: 10.1016/j.bpj.2018.11.006. Epub 2018 Nov 10. Biophys J. 2019. PMID: 30527447 Free PMC article.
-
The rational search for selective anticancer derivatives of the peptide Trichogin GA IV: a multi-technique biophysical approach.Sci Rep. 2016 Apr 4;6:24000. doi: 10.1038/srep24000. Sci Rep. 2016. PMID: 27039838 Free PMC article.
-
A mechanism of global shape-dependent recognition and phosphorylation of filamin by protein kinase A.J Biol Chem. 2015 Mar 27;290(13):8527-38. doi: 10.1074/jbc.M114.633446. Epub 2015 Feb 9. J Biol Chem. 2015. PMID: 25666618 Free PMC article.
References
-
- Berridge MJ, Bootman MD, Roderick HL (2003) Calcium signalling: dynamics, homeostasis and remodelling. Nat Rev Mol Cell Biol 4: 517–529 - PubMed
-
- Brocke L, Chiang LW, Wagner PD, Schulman H (1999) Functional implications of the subunit composition of neuronal CaM kinase II. J Biol Chem 274: 22713–22722 - PubMed
-
- Budil DE, Lee S, Saxena S, Freed JH (1996) Nonlinear-least-squares analysis of slow-motion EPR spectra in one and two dimensions using a modified Levenberg–Marquardt algorithm. J Mag Res Series A 120: 155–189
Publication types
MeSH terms
Substances
Grants and funding
LinkOut - more resources
Full Text Sources
Molecular Biology Databases
