. 2011 Apr 20;30(8):1593-607.
doi: 10.1038/emboj.2011.44. Epub 2011 Feb 22.

Endocytosis of EphA receptors is essential for the proper development of the retinocollicular topographic map

Affiliations

Endocytosis of EphA receptors is essential for the proper development of the retinocollicular topographic map

Sooyeon Yoo et al. EMBO J. .

Abstract

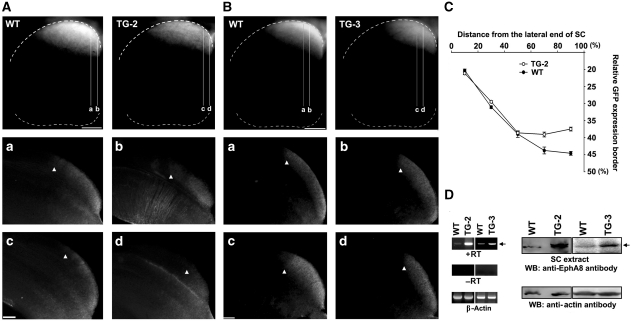
Endocytosis of Eph-ephrin complexes may be an important mechanism for converting cell-cell adhesion to a repulsive interaction. Here, we show that an endocytosis-defective EphA8 mutant forms a complex with EphAs and blocks their endocytosis in cultured cells. Further, we used bacterial artificial chromosome transgenic (Tg) mice to recapitulate the anterior>posterior gradient of EphA in the superior colliculus (SC). In mice expressing the endocytosis-defective EphA8 mutant, the nasal axons were aberrantly shifted to the anterior SC. In contrast, in Tg mice expressing wild-type EphA8, the nasal axons were shifted to the posterior SC, as predicted for the enhanced repellent effect of ephrinA reverse signalling. Importantly, Rac signalling was shown to be essential for EphA-ephrinA internalization and the subsequent nasal axonal repulsion in the SC. These results indicate that endocytosis of the Eph-ephrin complex is a key mechanism by which axonal repulsion is generated for proper guidance and topographic mapping.


Conflict of interest statement

The authors declare that they have no conflict of interest.

Figures

Figure 1
Figure 1
Identification of the EphA8 juxtamembrane region critical for ligand-induced endocytosis. (A) HEK293 cells stably expressing wild-type EphA8 or a EphA8 deletion mutant lacking the exon 10- or exon 9-encoded juxtamembrane region (EphA8-E10 and EphA8-E9, respectively) were stimulated with pre-clustered ephrinA5-Fc for 30 min. HEK293 cells were also transiently transfected with the ephrinA5-IRES-EGFP construct and stimulated with pre-clustered EphA8-Fc for 30 min. Cells were then fixed and permeabilized for immunostaining using a goat anti-human IgG conjugated with Texas Red dye (upper panels). To visualize internalized ephrinA5-Fc or EphA8-Fc, we washed cells with acid buffer for 10 min to remove surface-bound proteins before fixing and permeabilizing cells for immunostaining (lower panels). Scale bar=10 μm. (B) The data in Figure 1A were quantitated using ImageJ software. Data represent the mean±s.e. for at least five independent experiments, with 30 cells counted for each condition. Relative bindings of ephrinA5-Fc under different conditions were compared with that in the EphA8-transfected condition without or with acid washing (*P<0.001; **P<0.01, ANOVA). The amount of EphA8-Fc internalized into ephrinA5-expressing cells was not significantly different from that in GFP-transfected control cells (***P<0.001, Student’s t-test). (C) HEK293 cells stably expressing EphA4 were transiently transfected with the indicated IRES-EGFP-based EphA8 expression constructs, and experiments were carried out as described in Figure 1A. Scale bar=10 μm. (D) The data in Figure 1C were quantitated using ImageJ software, and only GFP-positive cells were selected for statistical analysis. Data represent the mean±s.e. of at least five independent experiments, with 40 cells counted for each condition. Relative bindings of ephrinA5-Fc under different conditions were compared with that in the EphA4-transfected condition without or with acid washing (*P<0.001; **P<0.01, ANOVA). (E) Cell lysates were subjected to immunoprecipitation (IP) using anti-EphA4 antibodies (Ab; left) or anti-HA Ab (right), and immune complexes were analysed by western blot (WB) using the indicated Ab (top panels). The blots were reprobed to determine the level of EphA4 or HA-tagged EphA8 proteins (bottom panels).
Figure 2
Figure 2
Aberrant retinocollicular mappings of nasal retinal axons in EphA8-E10 Tg mice. For anterograde tracing, P9 wild-type and EphA8-E10 Tg mice received a focal DiI injection in the ventronasal retina. After 36 h, the retina and SC were prepared, and the location of DiI in the retina and the Tz in the SC were determined. (A) Dorsal view of the SC in a wild-type mouse reveals a dense Tz in the posterior SC. The dotted lines mark the anterior and posterior border of the SC, respectively. Anterior is to the bottom and medial is to the left. The flat-mounted retina contralateral to the SC is shown in the smaller box, and the precise location of DiI is indicated by a dot. Nasal is to the left and dorsal is to the top. (B) Mid-sagittal section of the wild-type SC shown in A. Anterior is to the left and dorsal is to the top. (CE) Analysis of the EphA8-E10 Tg line 11. Experiments were carried out as described in A and B. (FI) Analysis of the EphA8-E10 Tg line 28. Experiments were carried out as described in A and B. Scale bar=100 μm in A, C and F and 50 μm in B, D, E and GI. (J) Statistical data revealing the topographic mapping defects in EphA8-E10 Tg mice as analysed by anterograde tracing.
Figure 3
Figure 3
Endocytotic defects of EphA receptors in primary SC cells of EphA8-E10 Tg mice. (A) Schematic map of the ephrinA5 genomic locus with the ephrinA5 BAC clone (RP23-23O22). (B) GFP fluorescent image of a flat-mounted retina from an ephrinA5-EGFP BAC Tg mice at P5. D, dorsal; V, ventral. Scale bar=200 μm. (C) GFP fluorescent image of a dorsal midbrain from an ephrinA5-EGFP BAC Tg mouse at P10. The GFP image was obtained 1 day after the right eye was enucleated to eliminate the contribution of EGFP-labelled RGC axon terminations to the left SC. Scale bar=200 μm. (D) Analysis of reverse endocytosis of ephrinAs in nasal RGCs (nRGCs). The ventronasal retina of the ephrinA5-EGFP Tg embryo (E15) was dissected out, dissociated and cultured for 2 days. Pre-clustered EphA8-Fc proteins were treated for 30 min and stained as described in Figure 1A. Scale bar=10 μm. (E) The data in Figure 3D were quantified as described in Figure 1B (n=40). *P<0.001, paired t-test. (F, G) Analysis of forward endocytosis of EphA receptors in primary SC cells. The anterior part of the SC (aSC) was dissociated from EphA8-E10 Tg embryos (E15) and their wild-type littermates. After 2 days, the cells were treated with pre-clustered ephrinA5-Fc for 30 min, fixed and incubated with FITC-conjugated anti-goat human IgG to detect cell surface-bound ephrinA5-Fc. Cells were then permeabilized, and internalized ephrinA5-Fc was stained as described in Figure 1A. (H) Quantitation of internalized ephrinA5-Fc in Figure 3F and G, represented by mean±s.e. (n=40). *P<0.001, Student’s t-test.
Figure 4
Figure 4
Topographic mapping analysis of EGFP-labelled nasal RGC axons in ephrinA5-EGFP; EphA8-E10 compound Tg mice. (A) The ephrinA5-EGFP line was crossed with the EphA8-E10 BAC Tg line 11, and their P9 littermates were examined for retinotopic mapping as described in Figure 3C. For each Tg line, the average position of the anterior border of the EGFP-labelled axon terminations from the posterior end of the SC was measured and expressed as a percentage of the anterior–posterior extent of the SC (top and third panel). Statistical data represent the mean (±s.e.) of 12–14 cases for each line. Corresponding sections from the SC of WT and TG-11 are shown in panels a–f. An arrowhead marks the anterior border of each EGFP-labelled termination domain. Scale bar=400 μm. (B) Experiments were carried out essentially as described in A, except that the ephrinA5-EGFP line was crossed with EphA8-E10 BAC Tg line 28. Arrows indicate ectopic termination domains separated from the rest of the nasal retinotopic domain. Statistical data represent the mean (±s.e.) of 10 to 12 cases for each line. Scale bar=400 μm.
Figure 5
Figure 5
Topographic mapping analysis of EGFP-labelled nasal RGC axons in ephrinA5-EGFP; EphA8 compound Tg mice. The ephrinA5-EGFP line was crossed with the EphA8 BAC Tg line, and their P9 littermates were examined for retinotopic mapping as described in Figure 4. EphA8 BAC Tg lines were generated by injecting the EphA8 BAC DNA (unmodified version of the RP23-357K18 clone). (A, B) Sagittal sections corresponding to the lines present in the SC of each Tg line are shown in panels a–d. An arrowhead marks the anterior border of each EGFP-labelled termination domain. Scale bar=400 μm. (C) Plot illustrating the average position of the anterior border of the EGFP-labelled axon terminations, expressed as a percentage of the anterior–posterior extent of the SC in WT or TG-2 Tg mice as described in Figure 4. Statistical data represent the mean±s.e. (n=9/each line). (D) Expression analysis using RT–PCR (left panels) or western blot (WB).
Figure 6
Figure 6
The EphA8-E10 mutant attracts axons from EGFP-labelled nasal RGCs. (A) The ventronasal part of the retina was dissected out of the ephrinA5-EGFP Tg embryo (E14.5), and this nasal retinal explant was co-cultured with two distinct HEK293 cell aggregates stably expressing either wild-type EphA8 or the EphA8-E10 mutant. Each cell aggregate was placed on the opposite side of the nasal retinal explant and incubated for 2 days on a coated petri dish. Retinal explants and cell aggregates were stained using a red fluorescent cell tracker to visualize the entire axonal growth pattern out of the retinal explant. (Panels a and b) The dotted boxes (marked by a and b) in A are enlarged to show only the EGFP-labelled RGC axons growing on each cell aggregate. The overall boundary of each cell aggregate is outlined by a dotted line. Scale bar=200 μm. (Panels a′ and b′) These images are identical to that in panels a and b. Many of the EGFP-labelled nasal RGC axons are very thin and could be clearly seen only under higher magnification. Therefore, using Adobe Photoshop, axon images taken under higher magnification were connected to record the detailed image of the entire axonal outgrowth field. Yellow lines mark EGFP-labelled axons growing out of the nasal retina explant, whereas the red circles represent the tip of each axon found within the boundary of each cell aggregate. (B) The EGFP-labelled axons on the cell aggregate were compared with the total number of axons growing out of the explant, which were counted by drawing their tracks. Data represent the mean of six different nasal RGC explants ±s.e. (*P<0.01, Student’s t-test).
Figure 7
Figure 7
Inhibition of Rac signalling in EphA8-expressing cells impairs trans-endocytosis of ephrinA5 and the repellent behaviour of nasal RGC axons. (A) Rac activity was measured by a pull-down assay (PD) of cell extracts prepared from HEK293 cells that stably express the indicated proteins. The GTP-bound form of Rac was precipitated by GST-Pak-1-RBD and probed with anti-Rac1 antibodies (Ab; top panel). Total levels of Rac were visualized by western blotting (WB) with anti-Rac1 Ab (middle panel). The levels of EphA8 were determined by blotting with anti-EphA8 Ab (bottom panel). (B) The ratio of GTP-Rac and total Rac levels were quantified and plotted as a bar graph ±s.e. (n=3). *P<0.001 versus EphA8 stable cell control (Student’s t-test). (C) Analysis of forward endocytosis in each condition was performed as described in Figure 1A. (D) The data in Figure 7C were quantified as described in Figure 1B. Relative binding of ephrinA5-Fc in the EphA8 and RacN17-overexpressing condition was compared with that in the EphA8-expressing condition without or with acid washing (*P<0001; Student’s t-test). (E) In vitro retinal explant culture was performed as described in Figure 6A. Two distinct HEK293 cell aggregates that stably express either wild-type EphA8 or both EphA8 and RacN17 were co-cultured with the ventronasal retina from an ephrinA5-EGFP Tg embryo (E14.5). The dotted boxes (marked by a and b) in E are enlarged to show only the EGFP-labelled RGC axons growing on each cell aggregate in panels a and b. The dotted line indicates the boundary of each cell aggregate. (F) The EGFP-labelled axons on the cell aggregate were compared with the total number of axons growing out of the explant, which were counted by drawing their tracks. Data represent the mean±s.e. from at least six independent experiments (*P<0.01, Student’s t-test).
Figure 8
Figure 8
Rac activity is required for EphA endocytosis and retinocollicular map formation. (A) The levels of active Rac in extracts from the anterior half of the SC from either EphA8-E10 or EphA8 Tg mice were measured as described in the legend for Figure 7A. Rac activity in different Tg mice was compared with that in wild-type littermates. (B) The results of Figure 8A were quantified (n=3). *P<0.01, ANOVA. (C) Expression of RacN17 in two different Tg lines, TG1 and TG2, was analysed by RT–PCR. (D) The levels of active Rac in the TG1-RacN17 line. Experiments were performed as described in A. (E) The data in Figure 8D were quantified (n=3). *P<001, Student’s t-test. (F) Analysis of forward endocytosis of EphA receptors in primary SC cells from WT, the TG-EphA8 line and the TG1-RacN17 Tg line. Experiments were performed as described in Figure 3F. (G) Quantitation of internalized ephrinA5-Fc in Figure 8F represented by mean±s.e. (n=40). *P<0.01, ANOVA. (H, I) The ephrinA5-EGFP line was crossed with two independent RacN17 BAC Tg lines, and their P9 littermates were examined for retinotopic mapping as described in Figure 4. Sagittal sections corresponding to the lines present in the SC are shown in panels a–d. Arrows indicate ectopic termination domains separated from the rest of the nasal retinotopic domain. The arrowhead marks the anterior border of each EGFP-labelled termination domain. (J, K) Plot illustrating the average position of the anterior border of the EGFP-labelled axon terminations, expressed as a percentage of the anterior–posterior extent of the SC in WT and either TG1 or TG2 line mice, as described in Figure 5C. Statistical data represent the mean of seven SC for TG1 or nine SC for TG2±s.e.
Figure 9
Figure 9
Model in which ephrinA trans-endocytosis into EphA-expressing SC cells regulates the repellent activity of nasal RGC axons. Contact of EphA-expressing cells with ephrinA-expressing axons induces the ephrinA–p75NTR complex to mediate a reverse signalling for axon repulsion but also induces the EphA–RacGEF complex to modulate Rac activity and actin polymerization, the possible critical events for Eph–ephrin endocytosis. EphA–ephrinA endocytotic processes cause destabilization of cell–cell contacts and initiate cell–cell detachment. Without involvement of these endocytotic processes, the ephrinA reverse signalling would not effectively lead to retraction of the nasal RGC axons away from anterior SC cells despite its potential repellent activity. One possible function of the exon10-encoded peptide region in EphA8 is to form a binding site for Rac-GEF critical for Eph–ephrin endocytosis. The EphA8-E10 mutant lacking this peptide region is defective in activating Rac signalling when it is bound to ephrinAs. Importantly, the EphA8-E10 mutant protein associates with other EphA receptors in the anterior SC. Therefore, after cell–cell contact, ephrinA–EphA complexes are not efficiently internalized into EphA8-E10-expressing cells. These enhanced adhesive events seem to override the repellent ephrinA reverse signal triggered by ephrinA–p75NTR complex, resulting in abnormal development of the retinocollicular topography.

Comment in

Similar articles

Cited by

References

    1. Batlle E, Bacani J, Begthel H, Jonkheer S, Gregorieff A, van de Born M, Malats N, Sancho E, Boon E, Pawson T, Gallinger S, Pals S, Clevers H (2005) EphB receptor activity suppresses colorectal cancer progression. Nature 435: 1126–1130 - PubMed
    1. Bruckner K, Klein R (1998) Signaling by Eph receptors and their ephrin ligands. Curr Opin Neurobiol 8: 375–382 - PubMed
    1. Choi S, Park S (1999) Phosphorylation at Tyr-838 in the kinase domain of EphA8 modulates Fyn binding to the Tyr-615 site by enhancing tyrosine kinase activity. Oncogene 18: 5413–5422 - PubMed
    1. Cowan CA, Henkemeyer M (2001) The SH2/SH3 adaptor Grb4 transduces B-ephrin reverse signals. Nature 413: 174–179 - PubMed
    1. Egea J, Klein R (2007) Bidirectional Eph-ephrin signaling during axon guidance. Trends Cell Biol 17: 230–238 - PubMed

Publication types

MeSH terms

LinkOut - more resources