. 2011 May;19(5):913-21.
doi: 10.1038/mt.2010.303. Epub 2011 Feb 22.

The actin cytoskeleton has an active role in the electrotransfer of plasmid DNA in mammalian cells

Affiliations

The actin cytoskeleton has an active role in the electrotransfer of plasmid DNA in mammalian cells

Christelle Rosazza et al. Mol Ther. 2011 May.

Abstract

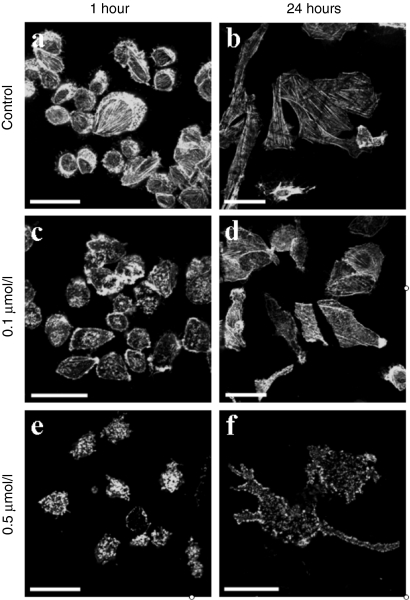
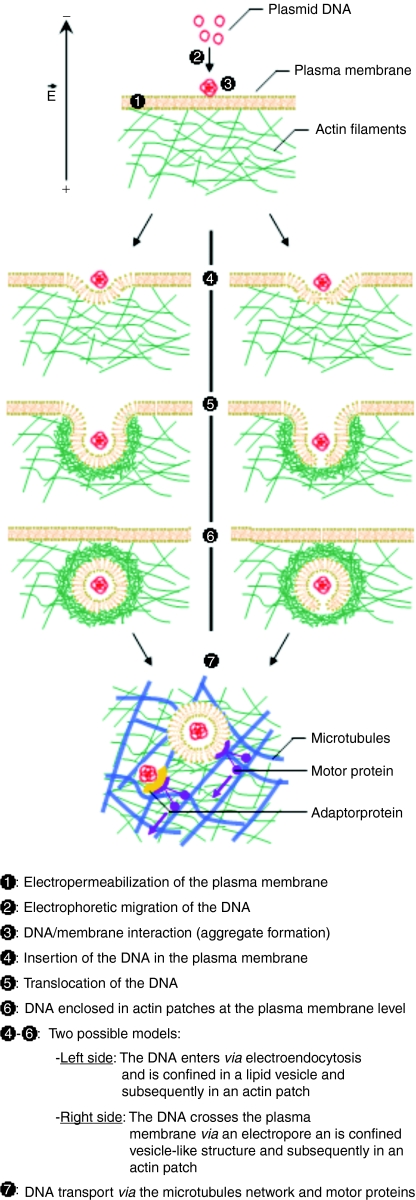
Electrotransfer of molecules is a well established technique which finds extensive use for gene transfer and holds great promise for anticancer treatment. Despite its widespread application, the mechanisms governing the entry of DNA into the cell and its intracellular trafficking are not yet known. The aim of this study is to unravel the role of the actin cytoskeleton during gene electrotransfer in cells. We performed single-cell level approaches to observe the organization of the actin cytoskeleton in Chinese hamster ovary (CHO) cells. In addition, we performed experiments at the multiple-cell level to evaluate the efficiency of DNA transfer after alteration of the actin cytoskeleton using the drug latrunculin B. Actin patches colocalizing with the DNA at the plasma membrane were observed with additional characteristics similar to those of the DNA aggregates in terms of time, number, and size. The disruption of the microfilaments reduces the DNA accumulation at the plasma membrane and the gene expression. This is the first direct experimental evidence of the participation of the actin cytoskeleton in DNA electrotransfer.


Figures

Figure 1
Figure 1
Effect of the electric field applied in the presence of plasmid DNA on the actin cytoskeleton organization in CHO cells. The cells were pulsed in the presence of the pEGFP-C1 plasmid DNA with the following parameters: 10 pulses of 5 ms at 0.4 kV/cm and 1 Hz. (ah) Cells were fixed 10 minutes after the application of the electric field and stained with phalloidin-rhodamine 123 dye (32 cells with actin patches were observed). The observations were performed using confocal microscopy. Panel b is a projection of a z-stack. The black arrow on the right side indicates the direction of the electric field. The white arrows on the pictures point to the actin patches formed at the plasma membrane facing the negative electrode. Bar = 20 µm. CHO, Chinese hamster ovary; EGFP, Enhanced green fluorescence protein.
Figure 2
Figure 2
Effect of the electric field applied in the presence of plasmid DNA on the actin cytoskeleton organization in CHO EGFP-actin expressing cells. CHO cells transiently expressing the EGFP-actin protein were pulsed in the presence of pEGFP-C1 plasmid DNA with the following parameters: 10 pulses of 5 ms at 0.4 kV/cm and 1 Hz. The observations were performed using wide field microscopy. (a–e) Time series of a cell, (f–g) another cell observed before the electric field application and 6 minutes after, (h–j) different cells at different times (25 cells with actin patches were observed). The black arrow on the right side indicates the direction of the electric field. The white arrows on the pictures point to the actin patches formed at the plasma membrane facing the negative electrode. Bar = 10 µm. CHO, Chinese hamster ovary; EGFP, enhanced green fluorescence protein.
Figure 3
Figure 3
Visualization of the DNA/membrane interaction and the actin cytoskeleton in CHO cells after application of the electric field. CHO cells transiently expressing the EGFP-actin protein were pulsed in the presence of POPO-3 labeled plasmid DNA (pEGFP-C1) with the following parameters: 10 pulses of 5 ms at 0.4 kV/cm and 1 Hz. The observations were performed using wide field microscopy between 5 and 30 minutes after application of the electric field. (a,d,g,j) POPO-3 labeled DNA, (b,e,h,k) EGFP-actin protein expression, (c,f,i,l) merge of the two channels (18 cells clearly showed colocalization between DNA and actin). The black arrow on the right side indicates the direction of the electric field. Bar = 5 µm. CHO, Chinese hamster ovary; EGFP, enhanced green fluorescence protein.
Figure 4
Figure 4
Effect of latrunculin B on the actin cytoskeleton organization in CHO cells. Filamentous actin was stained with phalloidin-rhodamine 123 dye after fixation of the sample. The observations were performed using confocal microscopy. (a,b) nontreated cells, (c,d,e,f) latrunculin B treated cells at 0.1 µmol/l (c,d) or 0.5 µmol/l (e,f), 37 °C for 1 hour (c,e) or 24 hours (d,f) (for each condition, a minimum of 50 cells were observed). Bar = 20 µm. CHO, Chinese hamster ovary.
Figure 5
Figure 5
Visualization of the DNA/membrane interaction and fluorescence intensity distribution of the DNA aggregates in CHO cells with and without latrunculin B drug treatment. The cells were pulsed in the presence of TOTO-1 labeled plasmid DNA (pEGFP-C1) with the following parameters: 10 pulses of 5 ms at 0.4 kV/cm and 1 Hz. (a,c,e,g) control cells, (b,d,f,h) latrunculin B treated cells (0.1 µmol/l, 37 °C, 1 hour before the electric field application) (in both conditions, 34 cells were visualized), (i) number of aggregates counted as a function of the fluorescence intensity in control (gray) and treated cells (black) (number of aggregates counted n = 330 for the control cells and n = 154 for the treated cells), (i inset) mean fluorescence intensity (mean + SEM). The black arrow on the right side indicates the direction of the electric field. Bar = 20 µm. CHO, Chinese hamster ovary; EGFP, enhanced green fluorescence protein.
Figure 6
Figure 6
Gene expression in CHO cells treated with latrunculin B before or after electric field application. The cells were transfected with pEGFP-C1 plasmid DNA with the following parameters: 10 pulses of 5 ms at 0.4 kV/cm and 1 Hz and analyzed by flow cytometry. (a) Percentage of transfected cells, (b) transfection efficiency both normalized in relation to T. Experiments were performed in triplicate and repeated seven times (mean + SEM). NT, nontreated and nontransfected cells; E, cells exposed to electric field but without DNA; T, nontreated but transfected cells (our reference); L1hT, latrunculin B incubation performed for 1 hour before the transfection; TL1h/TL24h, latrunculin B incubation performed for 1 hour /24 hours after the transfection; CHO, Chinese hamster ovary; EGFP, enhanced green fluorescence protein.
Figure 7
Figure 7
DNA electrotransfer possible mechanisms. It is a multistep process. During application of the electric pulses, the plasma membrane is permeabilized (step 1), the DNA, because of its negative charge, electrophoretically migrates toward the positive electrode (step 2). It interacts with the electropermeabilized membrane facing the negative electrode and forms aggregates (step 3). The electrophoretically driven insertion (step 4) and the translocation (step 5) of the DNA through the plasma membrane are not yet known but two models can be proposed. The DNA could pull the membrane during its insertion and initiate the formation of a vesicle; we can in this case speak about electroendocytosis (left side), or the DNA could be inserted where an electropore is formed, pull it, and initiate the formation of a vesicle-like structure (right side). The plasma membrane is in interaction with the actin network thanks to connecting proteins. The presence of vesicle or vesicle-like structure may induce the recruitment actin associated proteins and initiate its polymerization where the lipid–DNA complex is located (step 5 and 6). Other data indicate that DNA migration in the cytoplasm might occur via motor proteins interacting with the microtubule network (step 7)., The DNA could either be enclosed in the lipid vesicle or naked, and interacting with protein(s) providing the connection between it and the microtubule network. Subsequent steps are the crossing of the nuclear envelope and the expression in protein of the DNA sequence (not represented in the illustration here).

References

    1. Young LS, Searle PF, Onion D., and, Mautner V. Viral gene therapy strategies: from basic science to clinical application. J Pathol. 2006;208:299–318. - PubMed
    1. Deshayes S, Morris MC, Divita G., and, Heitz F. Cell-penetrating peptides: tools for intracellular delivery of therapeutics. Cell Mol Life Sci. 2005;62:1839–1849. - PMC - PubMed
    1. Karmali PP., and, Chaudhuri A. Cationic liposomes as non-viral carriers of gene medicines: resolved issues, open questions, and future promises. Med Res Rev. 2007;27:696–722. - PubMed
    1. Newman CM., and, Bettinger T. Gene therapy progress and prospects: ultrasound for gene transfer. Gene Ther. 2007;14:465–475. - PubMed
    1. Neumann E, Schaefer-Ridder M, Wang Y., and, Hofschneider PH. Gene transfer into mouse lyoma cells by electroporation in high electric fields. EMBO J. 1982;1:841–845. - PMC - PubMed

Publication types

LinkOut - more resources