. 2011 Jan 31:4:119.
doi: 10.3389/fninf.2010.00119. eCollection 2011.

NeuroMap: A Spline-Based Interactive Open-Source Software for Spatiotemporal Mapping of 2D and 3D MEA Data

Affiliations

NeuroMap: A Spline-Based Interactive Open-Source Software for Spatiotemporal Mapping of 2D and 3D MEA Data

Oussama Abdoun et al. Front Neuroinform. .

Abstract

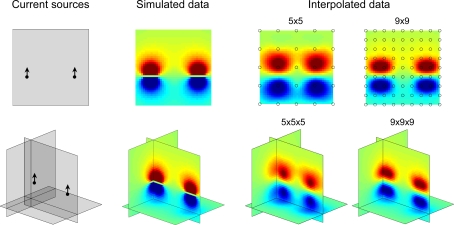
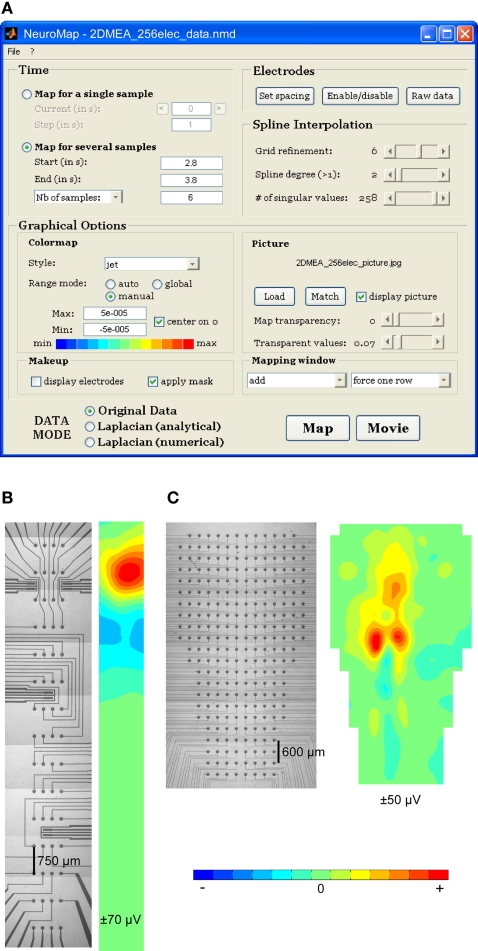
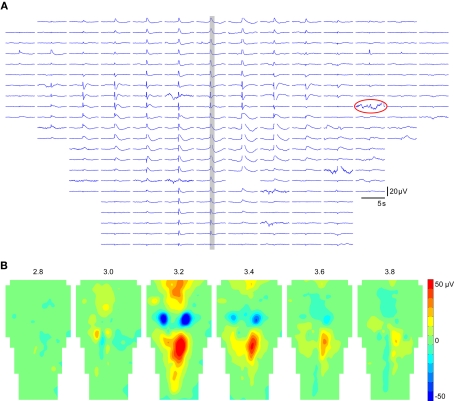
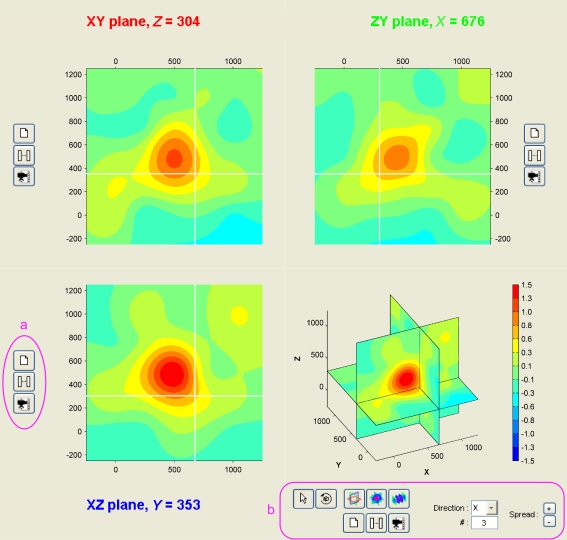
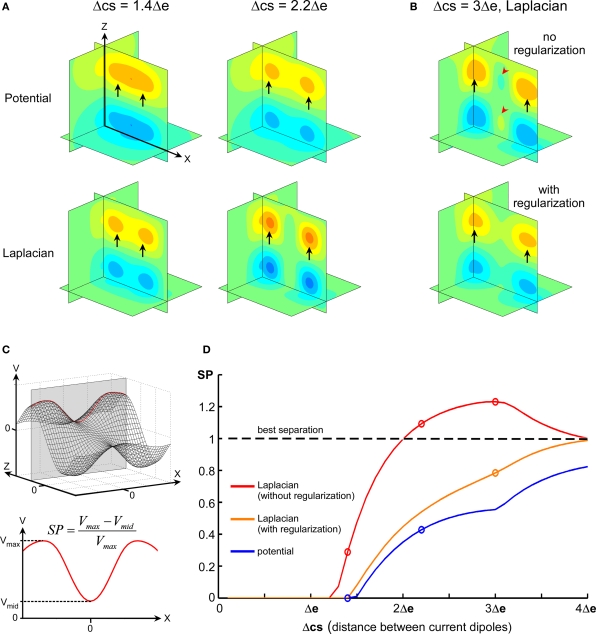
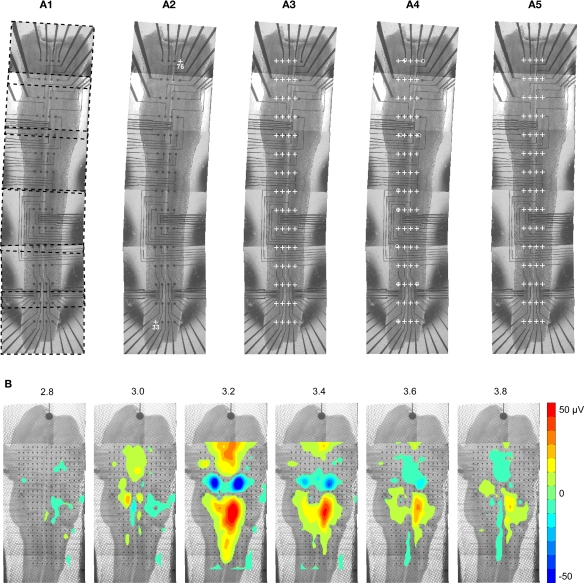
A major characteristic of neural networks is the complexity of their organization at various spatial scales, from microscopic local circuits to macroscopic brain-scale areas. Understanding how neural information is processed thus entails the ability to study them at multiple scales simultaneously. This is made possible using microelectrodes array (MEA) technology. Indeed, high-density MEAs provide large-scale coverage (several square millimeters) of whole neural structures combined with microscopic resolution (about 50 μm) of unit activity. Yet, current options for spatiotemporal representation of MEA-collected data remain limited. Here we present NeuroMap, a new interactive Matlab-based software for spatiotemporal mapping of MEA data. NeuroMap uses thin plate spline interpolation, which provides several assets with respect to conventional mapping methods used currently. First, any MEA design can be considered, including 2D or 3D, regular or irregular, arrangements of electrodes. Second, spline interpolation allows the estimation of activity across the tissue with local extrema not necessarily at recording sites. Finally, this interpolation approach provides a straightforward analytical estimation of the spatial Laplacian for better current sources localization. In this software, coregistration of 2D MEA data on the anatomy of the neural tissue is made possible by fine matching of anatomical data with electrode positions using rigid-deformation-based correction of anatomical pictures. Overall, NeuroMap provides substantial material for detailed spatiotemporal analysis of MEA data. The package is distributed under GNU General Public License and available at http://sites.google.com/site/neuromapsoftware.

Keywords: CSD; Laplacian; mapping; microelectrode array; spline interpolation.


Figures

Figure 1
Figure 1
2D and 3D maps of fictive MEA data. Left: current sources positions and orientations as described in Methods. Middle: simulated data computed on grids of 1681 and 68921 points for 2D and 3D configurations respectively. Right: data from fictive 5 × 5, 9 × 9, 5 × 5 × 5 and 9 × 9 × 9 MEAs interpolated on 1681 (2D) or 68921 (3D) points grids and mapped by NeuroMap. The potential field geometry can be estimated by interpolation. Note that the interpolated map is best for highest MEA resolution.
Figure 2
Figure 2
NeuroMap interface and mapping of experimental data from 2D MEAs. (A) NeuroMap interface for plane MEA-recorded data. (B) An example of rectangular 60-channel MEA (left) and corresponding map (right). (C) An example of irregularly shaped 256-channel MEA (left) and corresponding map (right).
Figure 3
Figure 3
Temporal and spatiotemporal representations of data in NeuroMap. (A) Example of time plot in the case of 256 electrodes, positioned according to the MEA geometry. The data of the time window highlighted in gray is represented in (B) by a series of maps at regular intervals. Note that one damaged electrode (circled in A) was disabled to construct the maps. Data displayed here were obtained from the averaging of 44 individual episodes expressing the same spatiotemporal pattern.
Figure 4
Figure 4
Volume representation of 3D MEA data. The NeuroMap interface for the exploration of 3D MEA-recorded activity presents data in three orthogonal slices: along XY (top-left), ZY (top-right), and XZ (bottom-left). White lines on each of these views indicate positions of the two other slices. User can shift these orthogonal slices in the volume by simple click on one of the three views. The interface also includes a volume view (bottom-right). To each view is associated a set of controls (a) for printing, temporal mapping, and video making. Extra controls (b) come with the volume view to modify the volume display mode: orthogonal slices (as shown here) or parallel slices; in the latter, direction and number of slices can be freely specified.
Figure 5
Figure 5
Comparative separation powers of raw potential and spatial Laplacian. (A) Maps illustrating the difference of separation performance between raw potential and Laplacian. (B) Top: map illustrating the phantom activity that can appear in the spatial Laplacian (red arrowheads). Bottom: phantom activity vanishes after regularization. (C) Illustration of how the SP index is calculated. In the simulated data, parallel current sources generate maximum potential field in the y = 0 plane (top). The line on which absolute maximum is reached is used. The SP index is defined using the local extrema on the maximum line (bottom). It has a value of 0 when the potential along the line has only one maximum, and is close to 1 for an optimal separation of the maxima. (D) Evolution of SP according to distance between sources (Δcs) for raw potential (blue), spatial Laplacian (red), and regularized Laplacian (orange). Circles indicate maps drawn in (A,B).
Figure 6
Figure 6
Coregistration of activity data onto anatomical picture. (A1) The picture of a whole embryonic hindbrain–spinal cord preparation recorded with a 4 × 15 MEA was rebuilt from six partial pictures (dashed frames). As partial pictures have not been perfectly aligned during reconstruction, the anatomical picture needs appropriate warping to match the real MEA geometry. (A2) First, user identifies two or more electrodes on the picture (white crosses). (A3) Using the identified electrodes coordinates, the program computes the scale of the picture and the theoretical positions of all electrodes (white crosses). As expected, these do not match the electrodes of the picture. (A4) In order to perform appropriate deformation of the picture, the user specifies the correspondence between theoretical and pictured positions for a few electrodes (white circles). These landmarks determine reference pixel displacements that are extrapolated for the whole image. (A5) Result after application of the deformation algorithm. (B) Mapping of activity on a matched anatomical picture of an embryonic hindbrain (data is identical to that of Figure 3B). In order to improve visibility of the anatomy, values in the noise range (±4 μV) were not displayed.

References

    1. Babiloni F., Babiloni C., Carducci F., Fattorini L., Onorati P., Urbano A. (1996). Spline Laplacian estimate of EEG potentials over a realistic magnetic resonance-constructed scalp surface model. Electroencephalogr. Clin. Neurophysiol. 98, 363–373 - PubMed
    1. Babiloni F., Babiloni C., Locche L., Cincotti F., Rossini P. M., Carducci F. (2000). High-resolution electro-encephalogram: source estimates of Laplacian-transformed somatosensory-evoked potentials using a realistic subject head model constructed from magnetic resonance images. Med. Biol. Eng. Comput. 38, 512–51910.1007/BF02345746 - DOI - PubMed
    1. Beggs J. M., Plenz D. (2003). Neuronal avalanches in neocortical circuits. J. Neurosci. 23, 11167–11177 - PMC - PubMed
    1. Berdondini L., van der Wal P. D., Guenat O., de Rooij N. F., Koudelka-Hep M., Seitz P., Kaufmann R., Metzler P., Blanc N., Rohr S. (2005). High-density electrode array for imaging in vitro electrophysiological activity. Biosens. Bioelectron. 21, 167–17410.1016/j.bios.2004.08.011 - DOI - PubMed
    1. Charvet G., Rousseau L., Billoint O., Gharbi S., Rostaing J. P., Joucla S., Trevisiol M., Bourgerette A., Chauvet P., Moulin C., Goy F., Mercier B., Colin M., Spirkovitch S., Fanet H., Meyrand P., Guillemaud R., Yvert B. (2010). BioMEA (TM): a versatile high-density 3D microelectrode array system using integrated electronics. Biosens. Bioelectron. 25, 1889–189610.1016/j.bios.2010.01.001 - DOI - PubMed

LinkOut - more resources