

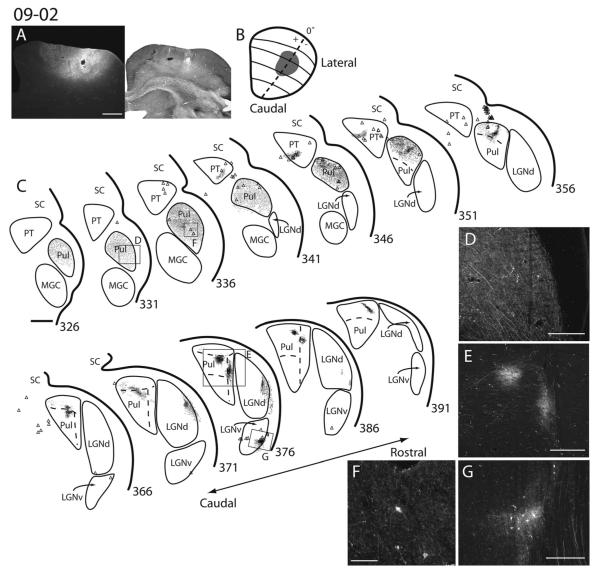
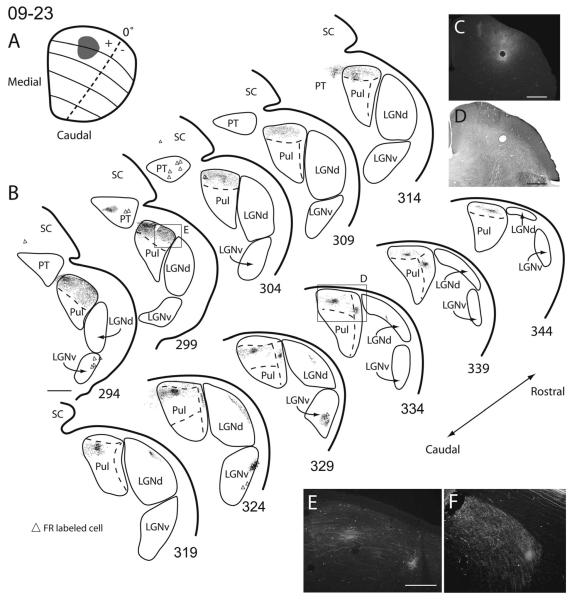
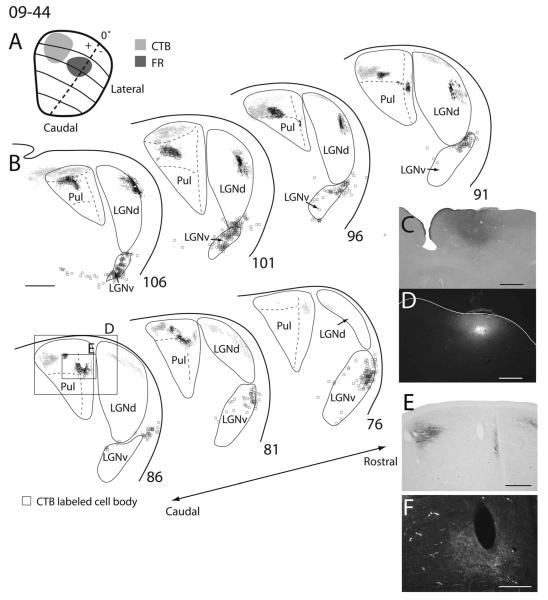
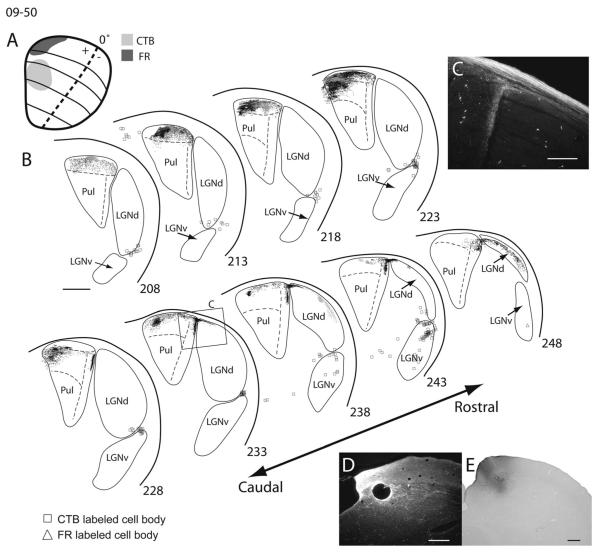
Superior colliculus connections with visual thalamus in gray squirrels (Sciurus carolinensis): evidence for four subdivisions within the pulvinar complex
- PMID: 21344403
- PMCID: PMC3686314
- DOI: 10.1002/cne.22552
Superior colliculus connections with visual thalamus in gray squirrels (Sciurus carolinensis): evidence for four subdivisions within the pulvinar complex
Abstract
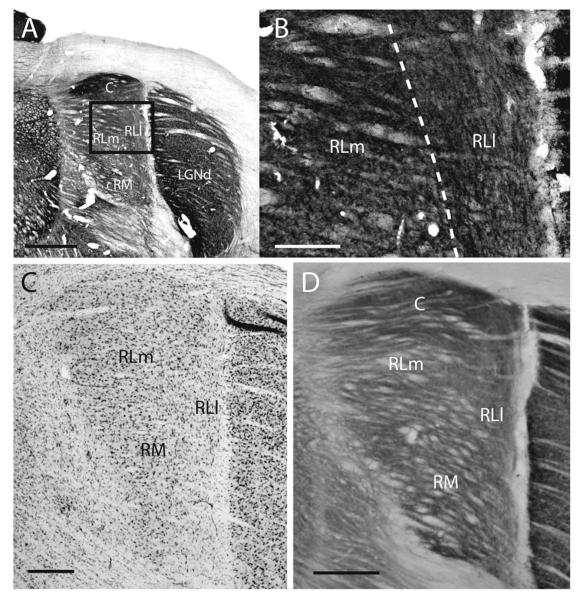
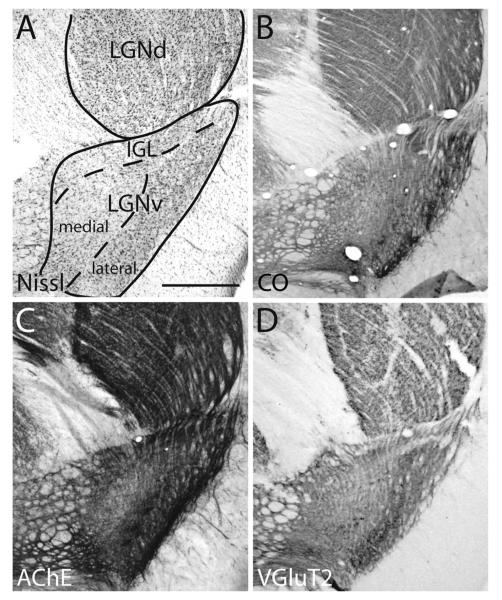
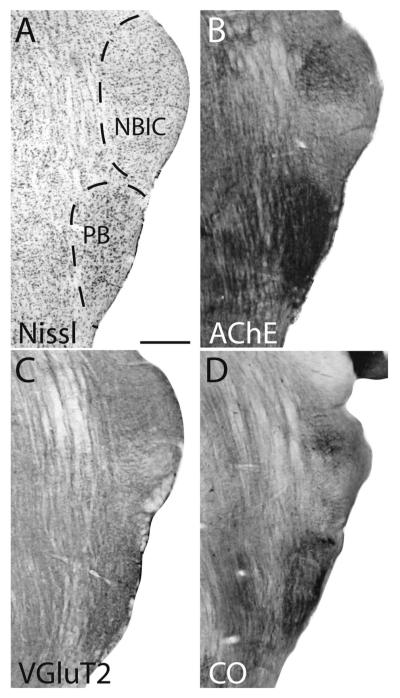
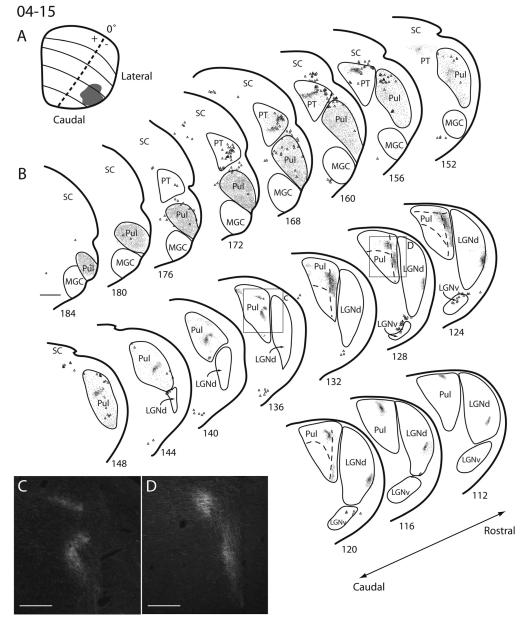
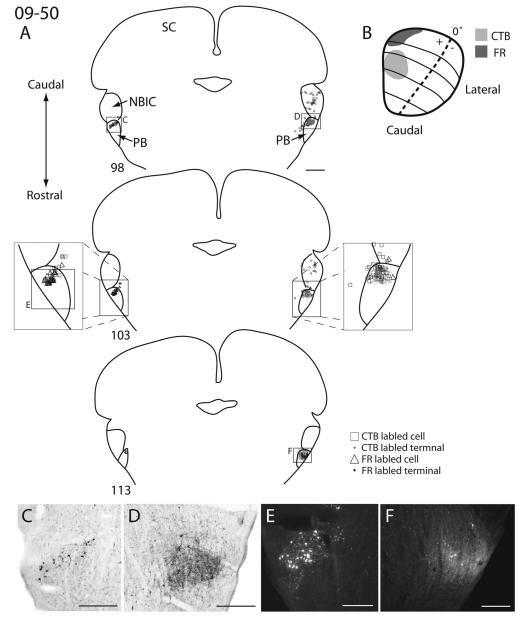
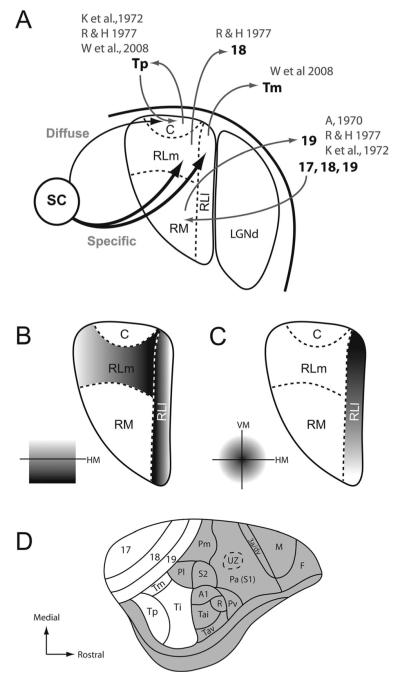
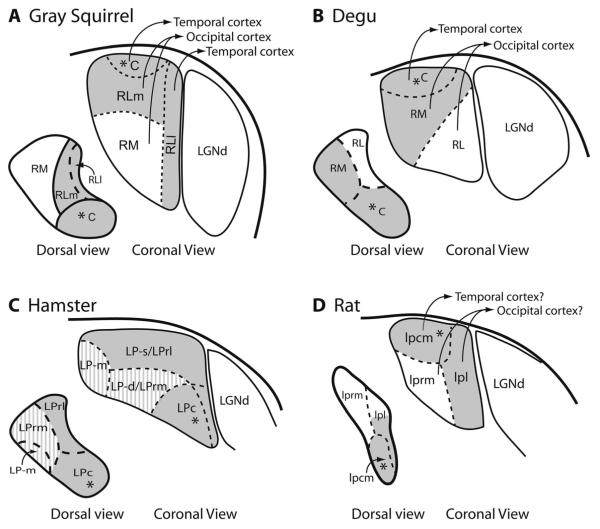
As diurnal rodents with a well-developed visual system, squirrels provide a useful comparison of visual system organization with other highly visual mammals such as tree shrews and primates. Here, we describe the projection pattern of gray squirrel superior colliculus (SC) with the large and well-differentiated pulvinar complex. Our anatomical results support the conclusion that the pulvinar complex of squirrels consists of four distinct nuclei. The caudal (C) nucleus, distinct in cytochrome oxidase (CO), acetylcholinesterase (AChE), and vesicular glutamate transporter-2 (VGluT2) preparations, received widespread projections from the ipsilateral SC, although a crude retinotopic organization was suggested. The caudal nucleus also received weaker projections from the contralateral SC. The caudal nucleus also projects back to the ipsilateral SC. Lateral (RLl) and medial (RLm) parts of the previously defined rostral lateral pulvinar (RL) were architectonically distinct, and each nucleus received its own retinotopic pattern of focused ipsilateral SC projections. The SC did not project to the rostral medial (RM) nucleus of the pulvinar. SC injections also revealed ipsilateral connections with the dorsal and ventral lateral geniculate nuclei, nuclei of the pretectum, and nucleus of the brachium of the inferior colliculus and bilateral connections with the parabigeminal nuclei. Comparisons with other rodents suggest that a variously named caudal nucleus, which relays visual inputs from the SC to temporal visual cortex, is common to all rodents and possibly most mammals. RM and RL divisions of the pulvinar complex also appear to have homologues in other rodents.
Copyright © 2011 Wiley-Liss, Inc.
Figures
References
-
- Abplanalp P. Some subcortical connections of the visual system in tree shrews and squirrels. Brain Behav Evol. 1970;3:155–168. - PubMed
-
- Albano JE, Humphrey AL, Norton TT. Laminar organization of receptive-field properties in tree shrew superior colliculus. J Neurophysiol. 1978;41:1140–1164. - PubMed
-
- Baizer JS, Whitney JF. Bilateral projections from the parabigeminal nucleus to the superior colliculus in monkey. Exp Brain Res. 1991;86:467–470. - PubMed
-
- Benevento LA, Standage GP. The organization of projections of the retinorecipient and nonretinorecipient nuclei of the pretectal complex and layers of the superior colliculus to the lateral pulvinar and medial pulvinar in the macaque monkey. J Comp Neurol. 1983;217:307–336. - PubMed
-
- Berson DM, Graybiel AM. Parallel thalamic zones in the LP-pulvinar complex of the cat identified by their afferent and efferent connections. Brain Res. 1978;147:139–148. - PubMed
Publication types
MeSH terms
Grants and funding
LinkOut - more resources
Full Text Sources
Research Materials
