

doi: 10.1002/anie.201006818.
Epub 2011 Jan 21.
Encapsulation of gold nanoparticles in a DNA origami cage
Affiliations
- PMID: 21344547
- PMCID: PMC3083863
- DOI: 10.1002/anie.201006818
Item in Clipboard
Encapsulation of gold nanoparticles in a DNA origami cage
Angew Chem Int Ed Engl.
.
No abstract available
Figures
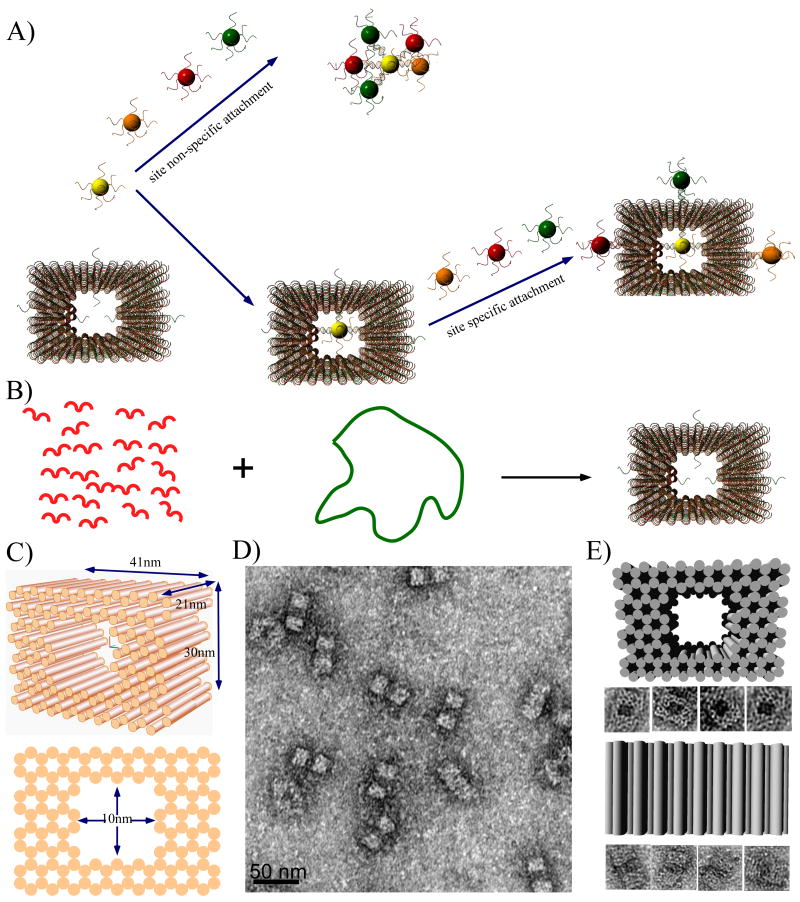
Schematic diagrams and TEM images of DNA origami cages. A) Schematics illustrating the challenge of assembling discrete nanoparticle architectures with site selective functionalization of the spherical nanoparticle surface. B) The formation of a DNA origami cage using short staple strands (red) to direct the folding of single stranded M13 DNA (green loop). Single stranded capture strands extend in or out of the DNA cage at specific positions. C) 3D and side view of the DNA origami cage, with 41 nm × 24 nm × 21 nm outer dimensions and 10 nm × 10 nm × 21 inner dimensions. D) Zoom out TEM image of a DNA origami cage (scale bar: 50 nm). E) Zoom in TEM images of DNA origami cages, displaying two different orientations.
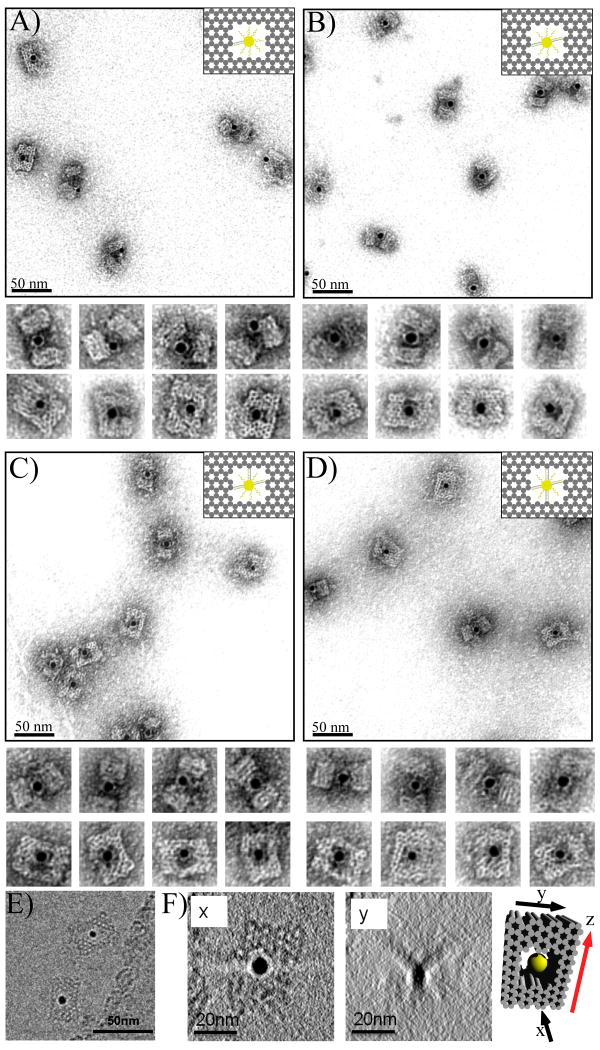
(A-D) TEM images of DNA cages with 5 nm AuNPs inside, encapsulated using different numbers of capture strands. (A) one; (B) two; (C) three; and (D) four capture strands. The samples were negatively stained with uranyl formate to improve the imaging contrast. (E) A typical cryo-EM image without negative stain showing the DNA cage with a 5 nm AuNP encapsulated inside. (F) The Z projections of the complete reconstructed cryo-EM tomogram from two different views. Planes x and y correspond to the black arrows shown on the model to the right; x corresponds to the top view easily seen in the un-tilted micrograph, while y is the face coming into view as the sample is tilted. The bold red arrow shown on the model indicates the rotation axis.
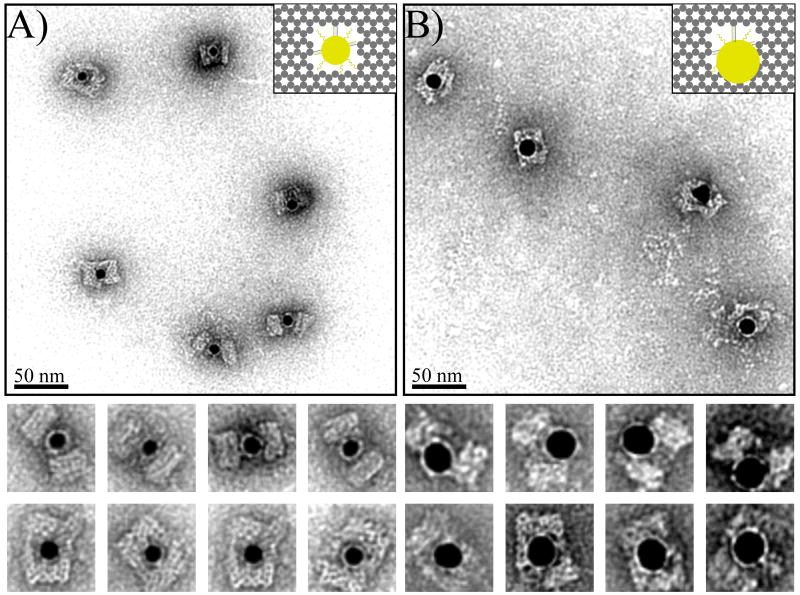
TEM images of DNA cages encapsulating 10 nm and 15 nm AuNPs using three capture DNA strands. (A) 10 nm AuNP; (B) 15 nm AuNP. The samples were negatively stained with uranyl formate before imaging.
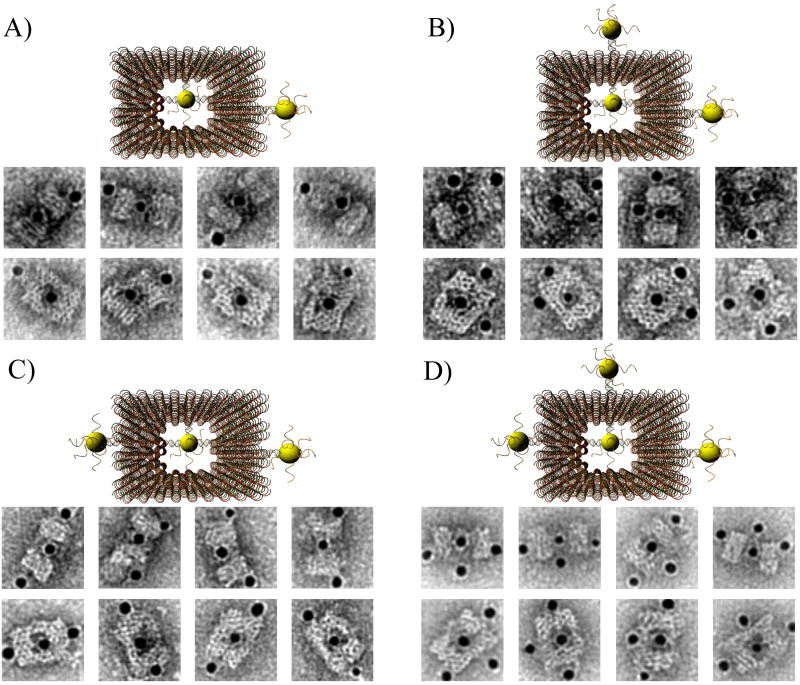
TEM images of DNA cages with one 5 nm AuNPs inside, and various numbers of 5 nm AuNPs outside. The samples were negatively stained with uranyl formate before imaging.
References
-
- Zanchet D, Micheel CM, Parak WJ, Gerion D, Alivisatos AP. Nano Letters. 2001;1:32–35.
-
- Zanchet D, Micheel CM, Parak WJ, Gerion D, Williams SC, Alivisatos AP. J Phys Chem B. 2002;106:11758–11763. - PubMed
-
- Sperling RA, Pellegrino T, Li JK, Chang WH, Parak WJ. Adv Funct Mater. 2006;16:943–948.
-
- Huo FW, Lytton-Jean AKR, Mirkin CA. Adv Mater. 2006;18:2304–2306.
Publication types
MeSH terms
Substances
Grants and funding
LinkOut - more resources
Full Text Sources
Other Literature Sources
