Comparative Study
. 2011 Feb 23:11:12.
doi: 10.1186/1471-2466-11-12.

Reducing LPS content in cockroach allergens increases pulmonary cytokine production without increasing inflammation: a randomized laboratory study

Affiliations
Comparative Study

Reducing LPS content in cockroach allergens increases pulmonary cytokine production without increasing inflammation: a randomized laboratory study

Sudha Natarajan et al. BMC Pulm Med. .

Abstract

Background: Endotoxins are ubiquitously present in the environment and constitute a significant component of ambient air. These substances have been shown to modulate the allergic response, however a consensus has yet to be reached whether they attenuate or exacerbate asthmatic responses. The current investigation examined whether reducing the concentration of lipopolysaccharide (LPS) in a house dust extract (HDE) containing high concentrations of both cockroach allergens 1 and LPS would attenuate asthma-like pulmonary inflammation.

Methods: Mice were sensitized with CRA and challenged with the intact HDE, containing 182 ng of LPS, or an LPS-reduced HDE containing 3 ng LPS, but an equivalent amount of CRA. Multiple parameters of asthma-like pulmonary inflammation were measured.

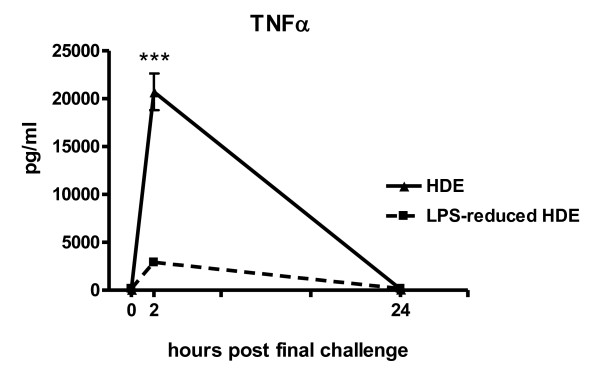
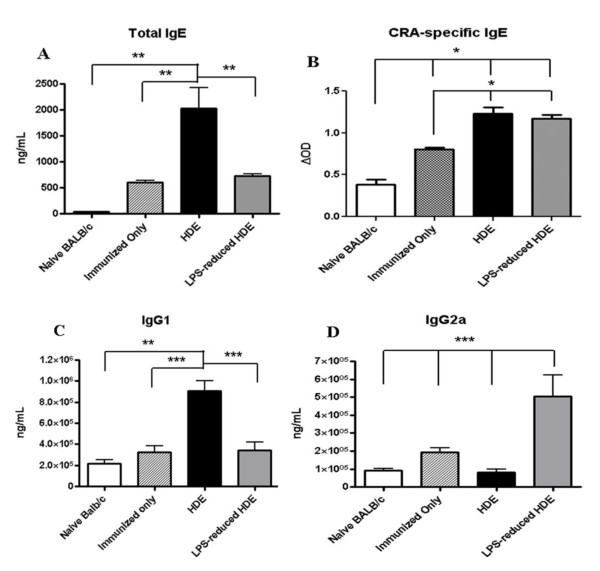
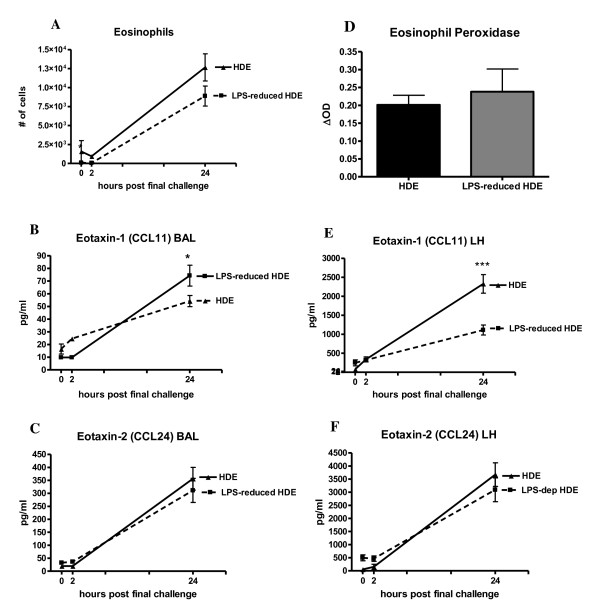
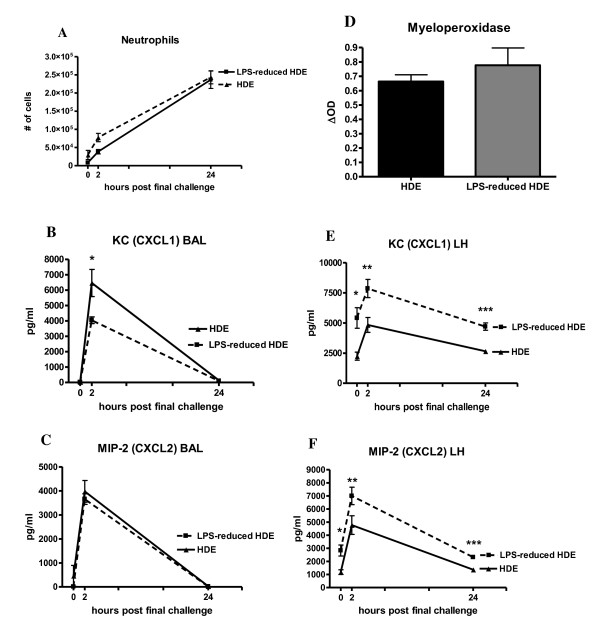
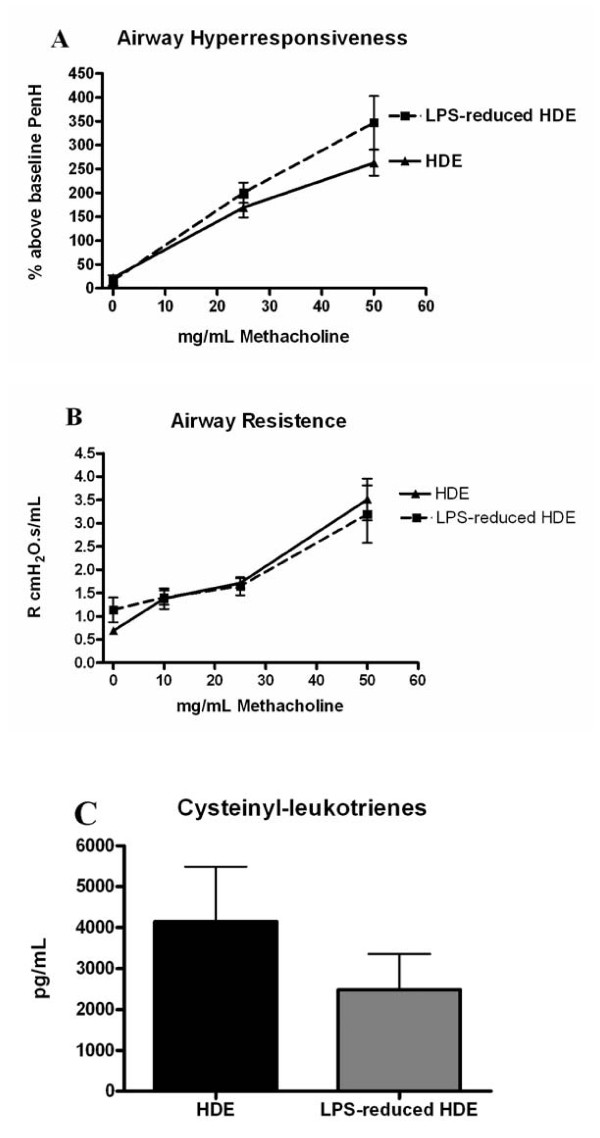
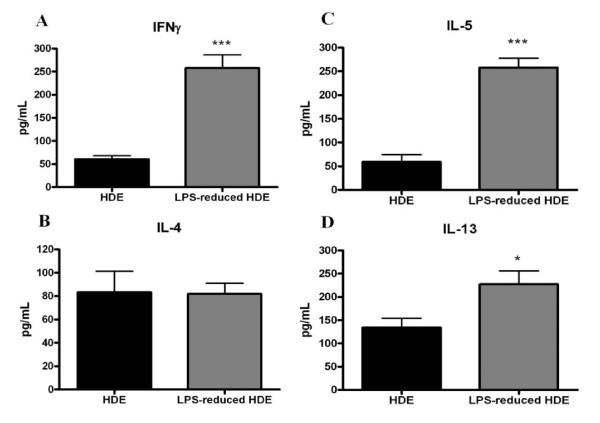
Results: Compared to HDE challenged mice, the LPS-reduced HDE challenged mice had significantly reduced TNFα levels in the bronchoalveolar lavage fluid. Plasma levels of IgE and IgG1 were significantly reduced, however no change in CRA-specific IgE was detected. In HDE mice, plasma IgG2a levels were similar to naïve mice, while LPS-reduced HDE mice had significantly greater concentrations. Reduced levels of LPS in the HDE did not decrease eosinophil or neutrophil recruitment into the alveolar space. Equivalent inflammatory cell recruitment occurred despite having generally higher pulmonary concentrations of eotaxins and CXC chemokines in the LPS-reduced HDE group. LPS-reduced HDE challenge induced significantly higher concentrations of IFNγ, and IL-5 and IL-13 in the BAL fluid, but did not decrease airways hyperresponsiveness or airway resistance to methacholine challenge.

Conclusion: These data show that reduction of LPS levels in the HDE does not significantly protect against the severity of asthma-like pulmonary inflammation.


Figures

Figure 1
Figure 1
TNFα production in bronchoalveolar lavage fluid. TNFα was measured by ELISA at the timepoints indicated. The 0 h sample was collected prior to the second pulmonary challenge. Data are represented as the mean ± SEM, in some data points the symbol is larger than the SEM. Experiments were done a minimum of 3 times with 3-4 mice per group, per experiment. ***p ≤ 0.0001 comparing the LPS-reduced HDE group to the HDE group by Student's t-test.
Figure 2
Figure 2
Plasma antibody levels in immunized and challenged mice. Plasma levels of A) IgE, B) CRA-specific IgE, C) IgG1, and D) IgG2a were measured by standard ELISA from EDTA-plasma collected 24 hours post final challenge (day 22). The immunized-only group was sensitized on Day 0 and plasma was collected on day 22. Data are represented as the mean ± SEM. Statistical significance was assessed by one-way ANOVA followed by Turkey's post test as indicated in each panel. Experiments were done a minimum of 3 times with 3-4 mice per group, per experiment. ** p < 0.001.
Figure 3
Figure 3
Cytospin preparations of cells recovered from BAL fluid. A) Naïve mice, B) HDE challenged mice and C) LPS-reduced HDE challenged mice at 24 hours post final challenge. Each is represented at 1000×. Representative eosinophils (Eo) and neutrophils (Ne) are indicated in the figure.
Figure 4
Figure 4
Eosinophil recruitment and production of eosinophil-specific chemokines in response to allergen challenge. Cytospin preparations from cells collected in the BAL fluid at the timepoints indicated were made and 300 cell differential counts performed to determine the absolute numbers of eosinophils (A). Concentrations of the chemokines B) CCL11 and C) CCL24 in the BAL fluid were measured by ELISA. D) Eosinophil peroxidase activity was measured in the lung tissue after BAL at 24 hours post final challenge. Concentrations of E) CCL11 and F) CCL24 in the lung homogenate were assayed by ELISA. Data are represented as the mean ± SEM. Experiments were done a minimum of 3 times with 3-4 mice per group, per experiment, in some data points the symbol is larger than the SEM. * p < 0.05 and *** p ≤ 0.0001 HDE vs. LPS-reduced HDE by Student's t-test.
Figure 5
Figure 5
Neutrophil recruitment and production of neutrophil-specific chemokines in response to allergen challenge. Cytospin preparations from cells collected in the BAL fluid at 24 hours post final challenge were made and 300 cell differential counts performed to determine the absolute numbers of A) neutrophils. Concentrations of chemokines B) CXCL1 and C) CXCL2 in the BAL fluid were measured by ELISA. D) Myeloperoxidase activity was measured in the lung tissue after BAL at 24 hours post final challenge. Concentrations of E) CXCL1 and F) CXCL2 in the lung homogenate were assayed by standard ELISA. Data are represented as the mean ± SEM, in some data points the symbol is larger than the SEM. Experiments were done a minimum of 3 times with 3-4 mice per group, per experiment. * p < 0.05, ** p ≤ 0.001 and *** p ≤ 0.0001 comparing the LPS-reduced HDE group to HDE the group by Student's t-test.
Figure 6
Figure 6
Airways hyperresponsiveness, airway resistance and cysteinyl leukotrienes post allergen challenge. A) For non-invasive measurement of AHR, mice were challenged with increasing concentrations of aerosolized methacholine at 4 hours after the final challenge and PenH values are represented as percent above baseline. B) For invasive measurements, mice were challenged with methacholine and pulmonary resistance is expressed as R cmH2O.s/mL. C) Cysteinyl leukotriene concentrations were measured in the BAL fluid 2 hours post final challenge. Data are represented as the mean ± SEM, in some data points the symbol is larger than the SEM. Experiments were done a minimum of 3 times with 3-4 mice per group, per experiment.
Figure 7
Figure 7
Th1 and Th2 cytokine production in the BAL fluid at 24 hours post final challenge. Cytokines were assayed by standard ELISA. Data are represented as the mean ± SEM. Experiments were done a minimum of 3 times with 3-4 mice per group, per experiment. * p < 0.05 and *** p ≤ 0.0001 comparing the LPS-reduced HDE to HDE the group by Student's t-test.

Similar articles

Cited by

References

    1. Morgan WJ, Crain EF, Gruchalla RS, O'Connor GT, Kattan M, Evans R, Stout J, Malindzak G, Smartt E, Plaut M. et al.Results of a home-based environmental intervention among urban children with asthma. N Engl J Med. 2004;351(11):1068–1080. doi: 10.1056/NEJMoa032097. - DOI - PubMed
    1. Bochner BS, Undem BJ, Lichtenstein LM. Immunological aspects of allergic asthma. Annu Rev Immunol. 1994;12:295–335. doi: 10.1146/annurev.iy.12.040194.001455. - DOI - PubMed
    1. Schroder NW, Arditi M. The role of innate immunity in the pathogenesis of asthma: evidence for the involvement of Toll-like receptor signaling. J Endotoxin Res. 2007;13(5):305–312. doi: 10.1177/0968051907084652. - DOI - PubMed
    1. Akira S, Uematsu S, Takeuchi O. Pathogen recognition and innate immunity. Cell. 2006;124(4):783–801. doi: 10.1016/j.cell.2006.02.015. - DOI - PubMed
    1. Sordillo JE, Hoffman EB, Celedon JC, Litonjua AA, Milton DK, Gold DR. Multiple microbial exposures in the home may protect against asthma or allergy in childhood. Clin Exp Allergy. pp. 902–910. - DOI - PMC - PubMed

Publication types