. 2011 Feb 24:9:21.
doi: 10.1186/1479-5876-9-21.

Alpha-1 antitrypsin protein and gene therapies decrease autoimmunity and delay arthritis development in mouse model

Affiliations

Alpha-1 antitrypsin protein and gene therapies decrease autoimmunity and delay arthritis development in mouse model

Christian Grimstein et al. J Transl Med. .

Abstract

Background: Alpha-1 antitrypsin (AAT) is a multi-functional protein that has anti-inflammatory and tissue protective properties. We previously reported that human AAT (hAAT) gene therapy prevented autoimmune diabetes in non-obese diabetic (NOD) mice and suppressed arthritis development in combination with doxycycline in mice. In the present study we investigated the feasibility of hAAT monotherapy for the treatment of chronic arthritis in collagen-induced arthritis (CIA), a mouse model of rheumatoid arthritis (RA).

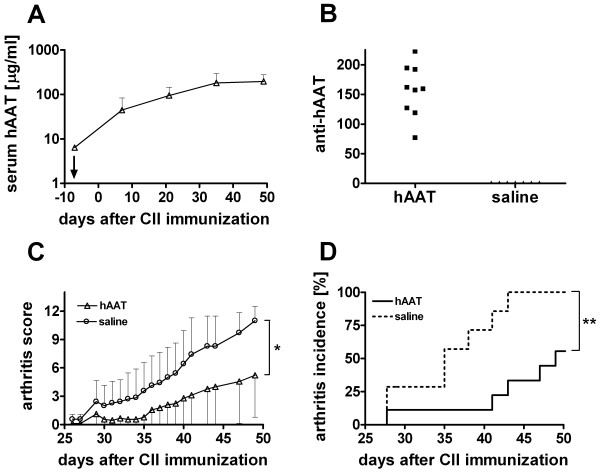
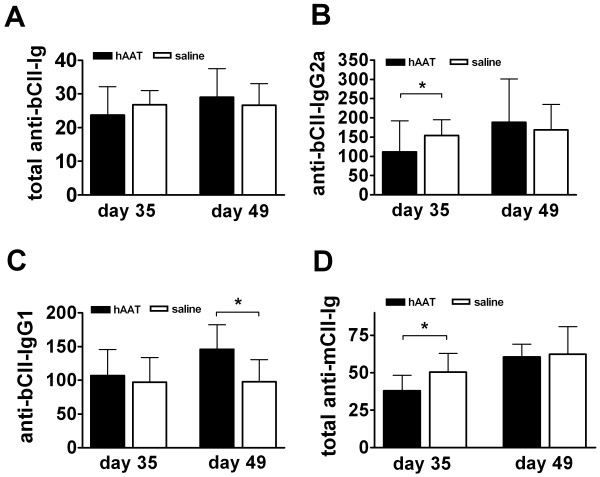
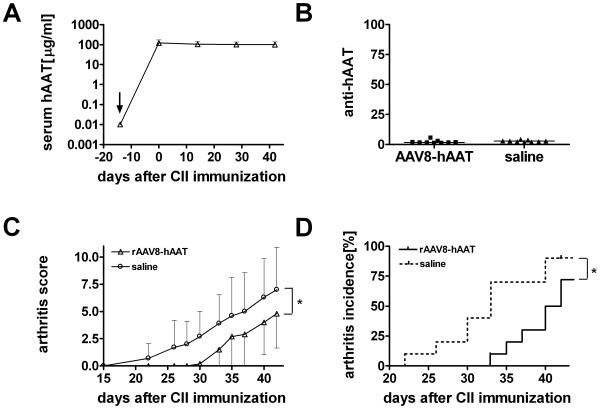
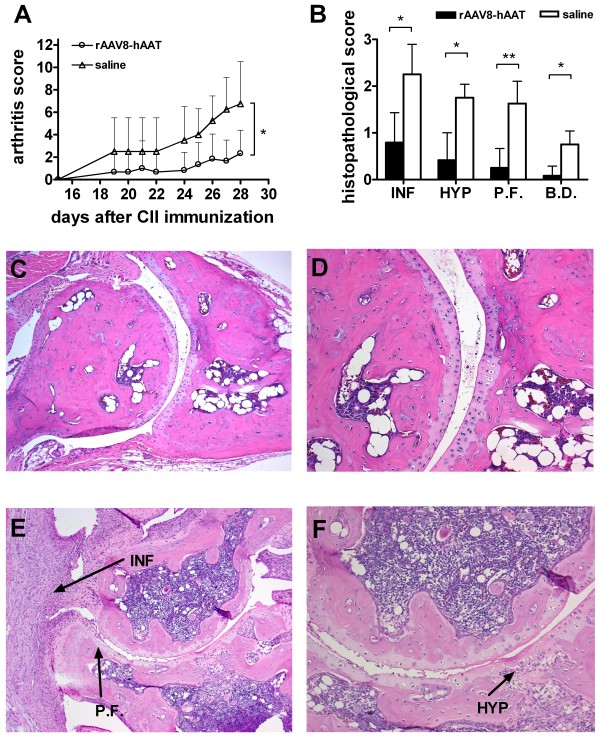
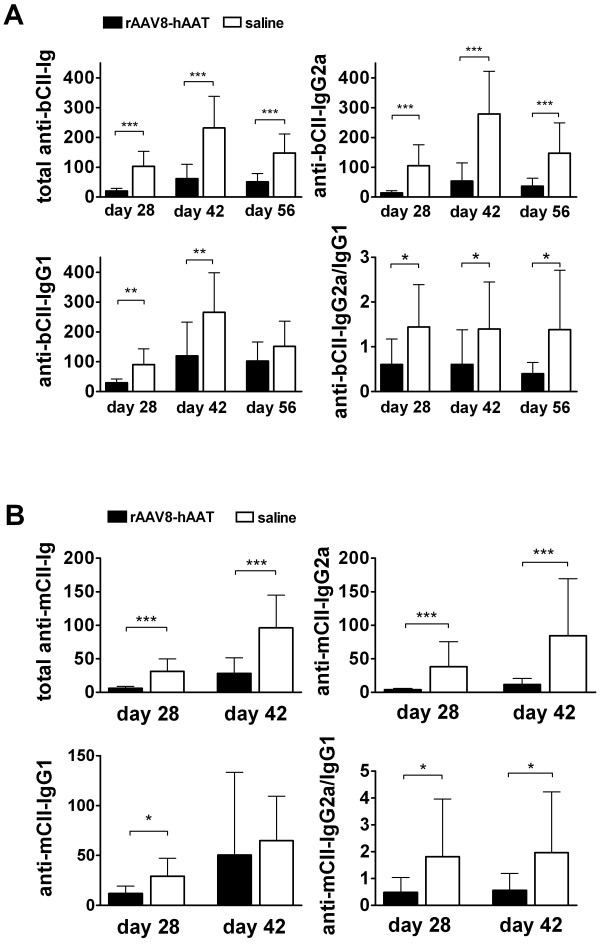
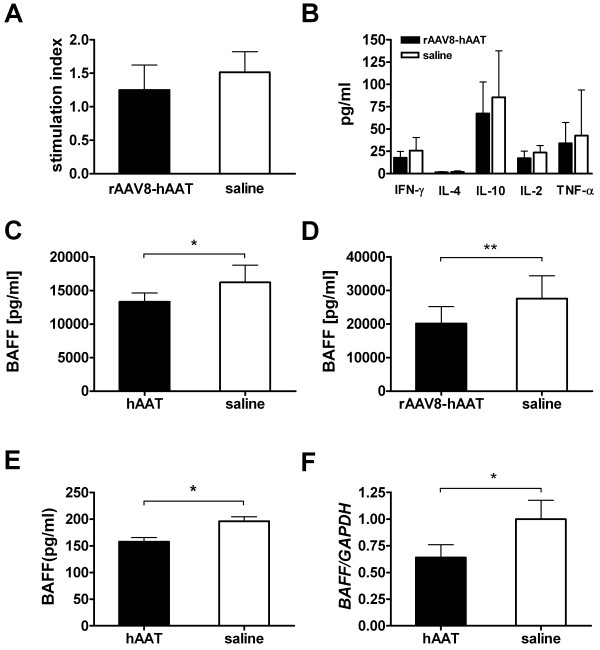
Methods: DBA/1 mice were immunized with bovine type II collagen (bCII) to induce arthritis. These mice were pretreated either with hAAT protein or with recombinant adeno-associated virus vector expressing hAAT (rAAV-hAAT). Control groups received saline injections. Arthritis development was evaluated by prevalence of arthritis and arthritic index. Serum levels of B-cell activating factor of the TNF-α family (BAFF), antibodies against both bovine (bCII) and mouse collagen II (mCII) were tested by ELISA.

Results: Human AAT protein therapy as well as recombinant adeno-associated virus (rAAV8)-mediated hAAT gene therapy significantly delayed onset and ameliorated disease development of arthritis in CIA mouse model. Importantly, hAAT therapies significantly reduced serum levels of BAFF and autoantibodies against bCII and mCII, suggesting that the effects are mediated via B-cells, at least partially.

Conclusion: These results present a new drug for arthritis therapy. Human AAT protein and gene therapies are able to ameliorate and delay arthritis development and reduce autoimmunity, indicating promising potential of these therapies as a new treatment strategy for RA.


Figures

Figure 1
Figure 1
Antiarthritic effect of human alpha 1 antitrypsin (hAAT) in collagen induced arthritis (CIA) model. Human AAT (Prolastin®) was intraperitoneally injected in DBA/1 mice (n = 9), twice per week starting 6 days before until day 70 after CII immunization. Control group received saline injections (n = 7) (A) Serum hAAT protein levels in DBA/1 mice were measured by ELISA (mean+SD). ↓ indicates the day of first hAAT injection. (B) Serum anti-hAAT antibody levels (anti-hAAT-IgG) in DBA/1 mice were measured by ELISA. Each dot represents antibody levels (day 49 after bCII immunization, arbitrary units) of an individual mouse. (C) Arthritis score. For each paw, 0 is normal and 4 is the most severe arthritis. The maximum score for each animal is 16. Each line represents the scores from hAAT treated group (open triangles, mean-SD) or control group (open circles, mean+SD, *p = 0.029 by AUC analysis) (D) Incidence of severe arthritis is defined by arthritic score/mouse > 3 (**p = 0.0025 by logrank test). Dotted line, saline injected control group; Solid line, hAAT treated group.
Figure 2
Figure 2
Anti-collagen II (CII) antibody levels after hAAT treatment. Anti-CII antibodies at day 35 and day 49 were tested by ELISA. Closed bars represent the average levels (n = 9, relative units, mean+SD) of antibodies in hAAT protein therapy treated group. Open bars represent the average levels (n = 7, relative units, mean+SD) of antibodies in saline injected group. (A) Levels of total Ig antibodies to bCII (total anti-bCII-Ig). (B) Levels of IgG2a anti-bCII (anti-bCII-IgG2a). (C) Levels of IgG1 anti-bCII (anti-bCII-IgG1). (D) Levels of total Ig antibodies to mCII (total anti-mCII-Ig). * p < 0.05 by Mann-Whitney U- test.
Figure 3
Figure 3
Human AAT gene therapy delays disease progression in CIA mouse model. DBA/1 mice were intraperitoneally injected with rAAV8-CB-hAAT vector (2 × 10¹¹ particles/mouse, n = 10) or saline (n = 10) two weeks before immunization with CII. Control group received saline. Mice were sacrificed on day 56 (EOS). (A) Serum levels of hAAT. hAAT protein serum levels in vector injected group were measured by ELISA (mean+SD). ↓ indicates the days of injection. (B) Anti-hAAT antibody levels. Serum anti-hAAT antibodies (anti-hAAT) were measured by ELISA using samples obtained at 56 days after immunization. Anti-hAAT antibodies were undetectable in the vector injected group. Each dot represents antibody level (arbitrary units) of an individual mouse. (C) Arthritis score. Each line represents the average score from hAAT treated group (open triangles, mean-SD) or control group (open circles, mean+SD, * p < 0.05 as determined by AUC analysis.) (D) Incidence of severe arthritis. Severe arthritis was defined by arthritic score > 3, (* p = 0.035 by logrank test.; 10 mice/group).
Figure 4
Figure 4
Tissue protective effect of hAAT gene therapy in CIA mouse model. DBA/1 mice were intraperitoneally injected with rAAV8-CB-hAAT vector (2 × 10¹¹ particles/mouse, n = 6) or saline (n = 4) two weeks before immunization with CII. Control group received saline. (A) Arthritis development was evaluated based on arthritis score (mean + SD). Open circle represent rAAV8-CB-hAAT vector injected group, open triangle represent control group. Mice were sacrificed on day 28 after CII immunization, hind limbs were harvested and processed for histological assessment. *p < 0.05 by Mann-Whitney U-test. (B) Histopathological evaluation of arthritis development. Mice in gene therapy group (black bars) or control group (empty bars) were evaluated according to histopathological changes by two blinded pathologists. Each hind paw was evaluated based on a scale ranging from 0-3. (mean+SD). *p < 0.05, **p < 0.01 by Mann-Whitney U-test. (INF: Infiltration of Immune Cells, HYP: Hyperplasia, P.F.: Pannus Formation, B.D.: Bone Destruction) (C,D) Representative joint section from mice receiving hAAT gene therapy. (E,F) Representative joint section from mice in control group (saline injection). Magnification: C,E: 100x; D,F: 200x.
Figure 5
Figure 5
Effect of hAAT gene therapy on auto-antibody production. Anti-CII antibodies at day 28, 42 and 56 were tested by ELISA. Black bars represent the average levels (n = 10, mean+SD) (relative units) of antibodies in hAAT gene therapy treated group. Open bars represent the average levels (n = 10, relative units, mean+SD) of antibodies in saline injected group. (A) Antibody levels against bovine CII (bCII). Top left panel, total Ig antibodies against bCII (total anti-bCII-Ig); Top right panel, levels of IgG2a anti-bCII (anti-bCII-IgG2a); Bottom left panel, levels of IgG1 anti-bCII (anti-bCII-IgG1); Bottom right panel, the ratio of anti-bCII-IgG2a to anti-bCII-IgG1 (anti-bCII-IgG2a/IgG1 ratio). (B) Antibody levels against mouse CII (mCII). Top left panel, total Ig antibodies against mCII (total anti-mCII-Ig); Top right panel, levels of IgG2a anti-mCII (anti-mCII-IgG2a); Bottom left panel, levels of IgG1 anti-mCII (anti-mCII-IgG1); Bottom right panel, the ratio of anti-mCII-IgG2a to anti-mCII-IgG1 (anti-mCII-IgG2a/IgG1). *p < 0.05, **p < 0.01, ***p < 0.001 by Mann-Whitney U- test.
Figure 6
Figure 6
Effects of hAAT therapy on T-cells and B-cells. (A) Proliferative response of splenocytes after stimulation with bovine type II collagen (bCII, 10 μg/ml). Splenocytes (4 × 10⁵ cells/well, in 96-well plate) were isolated on day 28 after rAAV8-hAAT injection. Black bar, AAT gene therapy group (n = 6); open bar, control group (n = 4). Data are expressed as the stimulation index, determined by calculating the ratio of cell proliferation with antigen (measured in counts per minute, cpm) relative to that with medium alone (mean+SD). (B) Cytokine production from bCII-stimulated (100 μg/ml) splenocytes. Values are the mean+SD of each group (n = 6 for rAAV8-hAAT group, black bars; n = 4 for saline group, open bars). (C) Serum level of BAFF in hAAT treated mice (black bar, n = 9, day 35) and control mice (open bar, n = 7). Data is expressed as mean+SD. (D) BAFF serum level in rAAV8-hAAT treated mice (black bar, n = 10, day 28) and control (open bar, n = 10). In vitro effect of hAAT on (E) BAFF secretion into culture medium measured by ELISA and (F) BAFF gene expression determined by real-time PCR. Murine macrophages (RAW 264.7) were treated with hAAT (0.5mg/ml, black bar). Culture medium served as control (open bar). Both experiments were performed in quadruplicates and repeated twice. Data is expressed as mean+SD. *p < 0.05, **p < 0.01.

Similar articles

Cited by

References

    1. Firestein GS. Evolving concepts of rheumatoid arthritis. Nature. 2003;423:356–361. doi: 10.1038/nature01661. - DOI - PubMed
    1. Edwards CJ, Cooper C. Early environmental factors and rheumatoid arthritis. Clin Exp Immunol. 2006;143:1–5. doi: 10.1111/j.1365-2249.2005.02940.x. - DOI - PMC - PubMed
    1. McInnes IB, Schett G. Cytokines in the pathogenesis of rheumatoid arthritis. Nat Rev Immunol. 2007;7:429–442. doi: 10.1038/nri2094. - DOI - PubMed
    1. Muller-Ladner U, Pap T, Gay RE, Neidhart M, Gay S. Mechanisms of disease: the molecular and cellular basis of joint destruction in rheumatoid arthritis. Nat Clin Pract Rheumatol. 2005;1:102–110. doi: 10.1038/ncprheum0047. - DOI - PubMed
    1. Smolen JS, Aletaha D, Koeller M, Weisman MH, Emery P. New therapies for treatment of rheumatoid arthritis. Lancet. 2007;370:1861–1874. doi: 10.1016/S0140-6736(07)60784-3. - DOI - PubMed

Publication types

MeSH terms