Interferon-gamma, macrophages, and virus spread after HSV-1 injection
- PMID: 21345992
- PMCID: PMC3175943
- DOI: 10.1167/iovs.10-6449
Interferon-gamma, macrophages, and virus spread after HSV-1 injection
Abstract
Purpose: After uniocular anterior chamber (AC) injection of HSV-1, the anterior segment of BALB/c mice becomes inflamed and infected; however, virus does not spread from the anterior segment to cause retinitis in the injected eye. The purpose of these studies was to determine whether interferon (IFN-)-γ and Mac-1(+) cells play a role in preventing direct anterior-to-posterior spread of HSV-1 in the injected eye.
Methods: One AC of adult female BALB/c mice was injected with HSV-1 (KOS). The location of IFN-α, IFN-β, and IFN-γ in the injected eye was determined by immunofluorescence, and mRNA expression was quantified by qPCR. Injected eyes of IFN-γ knockout or clodronate-treated macrophage-depleted mice were examined to determine whether the absence of IFN-γ or Mac-1(+) macrophages affected the sites or timing of virus spread.
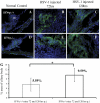
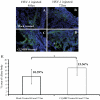
Results: IFN-α, IFN-β, and IFN-γ were observed in the anterior segment of injected eyes through 72 hours and mRNA levels of IFN-β and IFN-γ were increased in virus-infected eyes 48 to 120 hours after infection. However, the absence of IFN-γ or macrophages did not affect either the sites or the timing of HSV-1 infection in injected eyes.
Conclusions: Protection of the retina of the injected eye does not depend on a single cell type or cytokine. In addition, in the eye, as in other sites of the body, there are redundancies in the innate response to virus infection.
Figures


Similar articles
-
Infiltrating cells and IFNgamma production in the injected eye after uniocular anterior chamber inoculation of HSV-1.Invest Ophthalmol Vis Sci. 2009 May;50(5):2269-75. doi: 10.1167/iovs.08-2874. Invest Ophthalmol Vis Sci. 2009. PMID: 19387084 Free PMC article.
-
An M2 Rather than a TH2 Response Contributes to Better Protection against Latency Reactivation following Ocular Infection of Naive Mice with a Recombinant Herpes Simplex Virus 1 Expressing Murine Interleukin-4.J Virol. 2018 Apr 27;92(10):e00051-18. doi: 10.1128/JVI.00051-18. Print 2018 May 15. J Virol. 2018. PMID: 29491152 Free PMC article.
-
Rapid spread of a neurovirulent strain of HSV-1 through the CNS of BALB/c mice following anterior chamber inoculation.J Neurovirol. 2002 Apr;8(2):122-35. doi: 10.1080/13550280290049570. J Neurovirol. 2002. PMID: 11935464
-
Inborn errors of interferon (IFN)-mediated immunity in humans: insights into the respective roles of IFN-alpha/beta, IFN-gamma, and IFN-lambda in host defense.Immunol Rev. 2008 Dec;226:29-40. doi: 10.1111/j.1600-065X.2008.00698.x. Immunol Rev. 2008. PMID: 19161414 Review.
-
Type I interferons and herpes simplex virus infection: a naked DNA approach as a therapeutic option?Immunol Res. 2001;24(1):1-11. doi: 10.1385/IR:24:1:01. Immunol Res. 2001. PMID: 11485206 Review.
Cited by
-
Infectious Eye Diseases and Prevention Control.Microorganisms. 2023 May 15;11(5):1286. doi: 10.3390/microorganisms11051286. Microorganisms. 2023. PMID: 37317260 Free PMC article.
-
Pathobiology and treatment of viral keratitis.Exp Eye Res. 2021 Apr;205:108483. doi: 10.1016/j.exer.2021.108483. Epub 2021 Feb 6. Exp Eye Res. 2021. PMID: 33556334 Free PMC article. Review.
-
Immunological aspects of acute and recurrent herpes simplex keratitis.J Immunol Res. 2014;2014:513560. doi: 10.1155/2014/513560. Epub 2014 Sep 7. J Immunol Res. 2014. PMID: 25276842 Free PMC article. Review.
-
Pathological processes activated by herpes simplex virus-1 (HSV-1) infection in the cornea.Cell Mol Life Sci. 2019 Feb;76(3):405-419. doi: 10.1007/s00018-018-2938-1. Epub 2018 Oct 16. Cell Mol Life Sci. 2019. PMID: 30327839 Free PMC article. Review.
-
Type I Interferon Signaling Is Critical During the Innate Immune Response to HSV-1 Retinal Infection.Invest Ophthalmol Vis Sci. 2022 Dec 1;63(13):28. doi: 10.1167/iovs.63.13.28. Invest Ophthalmol Vis Sci. 2022. PMID: 36583876 Free PMC article.
References
-
- Biron CA, Sen GC. Innate response to viral infections. In: Knipe DM, Howley PM. Fields Virology. 5th ed Philadelphia: Lippincott Williams & Wilkins; 2007;321–359
-
- Colonna M, Trinchieri G, Liu Y-J. Plasmacytoid dendritic cells in immunity. Nat Immunol. 2004;5:1219–1226 - PubMed
-
- Kawanokuchi J, Mizuno T, Takeuchi H, et al. Production of interferon-gamma by microglia. Mult Scler. 2006;12:558–564 - PubMed
-
- Zheng M, Atherton SS. Cytokine profiles and inflammatory cells during HSV-1 induced acute retinal necrosis. Invest Ophthalmol Vis Sci. 2005;46:1356–1363 - PubMed
Publication types
MeSH terms
Substances
Grants and funding
LinkOut - more resources
Full Text Sources
Medical
Molecular Biology Databases
Research Materials

