. 2011 Jun;300(6):C1404-14.
doi: 10.1152/ajpcell.00270.2010. Epub 2011 Feb 23.

Redistribution of the tight junction protein ZO-1 during physiological shedding of mouse intestinal epithelial cells

Affiliations

Redistribution of the tight junction protein ZO-1 during physiological shedding of mouse intestinal epithelial cells

Yanfang Guan et al. Am J Physiol Cell Physiol. 2011 Jun.

Abstract

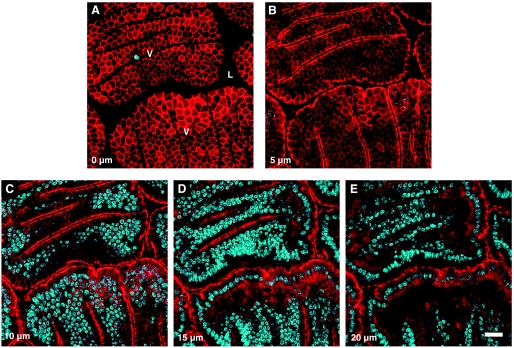
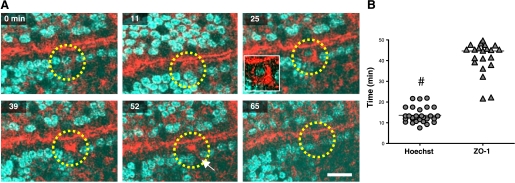
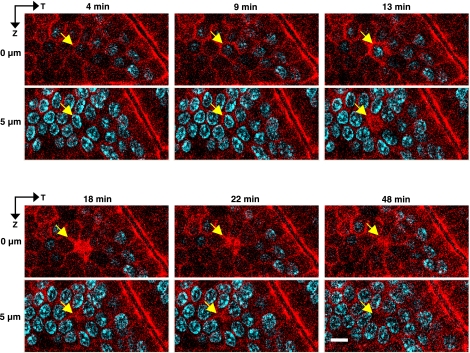
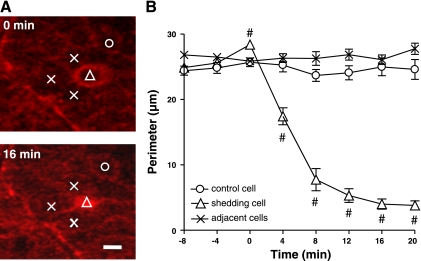
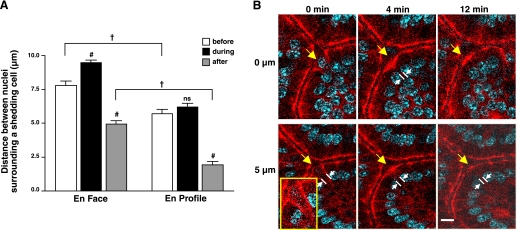
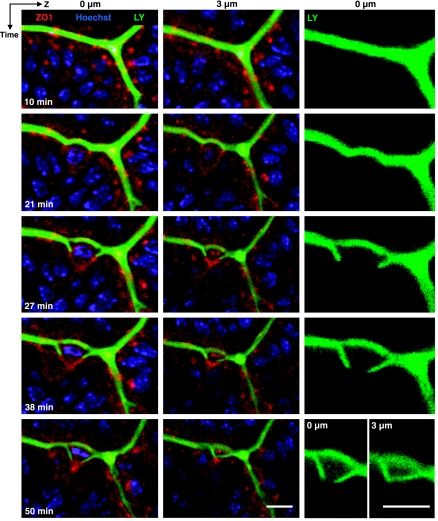
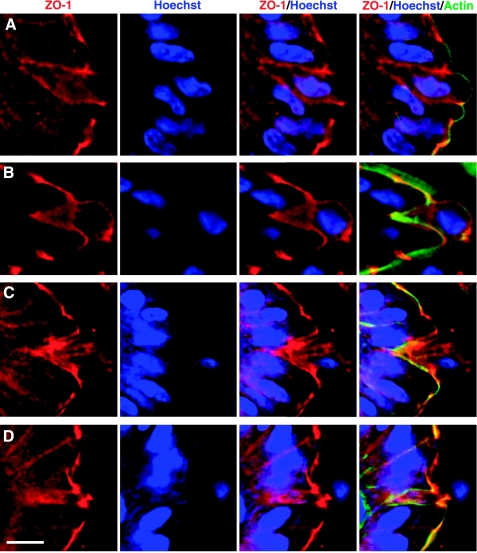
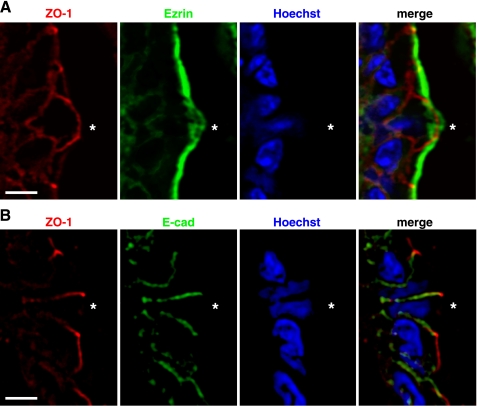
We questioned how tight junctions contribute to intestinal barrier function during the cell shedding that is part of physiological cell renewal. Intravital confocal microscopy studied the jejunal villus epithelium of mice expressing a fluorescent zonula occludens 1 (ZO-1) fusion protein. Vital staining also visualized the cell nucleus (Hoechst staining) or local permeability to luminal constituents (Lucifer Yellow; LY). In a cell fated to be shed, ZO-1 redistributes from the tight junction toward the apical and then basolateral cell region. ZO-1 rearrangement occurs 15 ± 6 min (n = 28) before movement of the cell nucleus from the epithelial layer. During cell extrusion, permeation of luminal LY extends along the lateral intercellular spaces of the shedding cell only as far as the location of ZO-1. Within 3 min after detachment from the epithelial layer, nuclear chromatin condenses. After cell loss, a residual patch of ZO-1 remains in the space previously occupied by the departed cell, and the size of the patch shrinks to 14 ± 2% (n = 15) of the original cell space over 20 min. The duration of cell shedding measured by nucleus movement (14 ± 1 min) is much less than the total duration of ZO-1 redistribution at the same sites (45 ± 2 min). In about 15% of cell shedding cases, neighboring epithelial cells also undergo extrusion with a delay of 5-10 min. With the use of normal mice, ZO-1 immunofluorescent staining of fixed tissue confirmed ZO-1 redistribution and the presence of ZO-1 patches beneath shedding cells. Immunostaining also showed that redistribution of ZO-1 occurred without corresponding mixing of apical and basolateral membrane domains as marked by ezrin or E-cadherin. ZO-1 redistribution is the earliest cellular event yet identified as a herald of physiological cell shedding, and redistribution of tight junction function along the lateral plasma membrane sustains epithelial barrier during cell shedding.


Figures

Fig. 1.
Fig. 1.
Confocal microscopy of villi (V) of the mouse jejunum, showing the distribution of the zonula occludens-1 (ZO-1) fusion protein (monomeric red fluorescent protein, mRFP1, red) in the epithelial cell layer, and cell nuclei stained with Hoechst 33342 (blue). ZO-1 can be seen in both en face view (A), where the epithelial cells are cross-sectioned at the surface of the villi, and en profile view (B–E), where the cells are observed from the side, at progressively deeper focus levels, at 5-μm intervals along the Z-axis. L, intestinal lumen. Scale bar = 20 μm.
Fig. 2.
Fig. 2.
En profile imaging of cell shedding and ZO-1 redistribution in vivo. A: time-course imaging of epithelial villus cell that undergoes extrusion (yellow circle), visualizing mRFP1-ZO-1 (red) and Hoechst 33342 (blue) recorded in en profile view. Apical redistribution of ZO-1 is seen at 11 min, with funnel-shape formation of ZO-1 migrating to the basal pole and engulfing the upward moving cell nucleus at 25 min. Eventually, the epithelial cell is extruded into the lumen, leaving a “gap” behind (white arrow) while remaining ZO-1 appears condensed at the site of shedding (39–65 min). Scale bar = 10 μm. B: cell shedding time span measured with Hoechst 33342 (between initiation of cell nucleus migration and extrusion) and ZO-1 (between initial accumulation in the apical cytoplasm and the final apical retention after extrusion). Values are means ± SE; #P < 0.001; n = 28 time courses in 18 mice.
Fig. 3.
Fig. 3.
En face imaging of cell shedding and ZO-1 redistribution in vivo. Time-course imaging of the fate of a shedding epithelial cell (arrow) in en face view at multiple time points and at two Z-axis focal depths (0 and 5 μm), revealing shedding while ZO-1 encircles the nucleus (9–13 min) and residual ZO-1 accumulation is visible in the epithelial layer after cell extrusion (≥18 min) as an extended patch that marks the site of cell loss. The ZO-1 patch shrinks over time. Scale bar = 5 μm.
Fig. 4.
Fig. 4.
Time course of gap resolution after cell shedding. A: representative images directly after cell shedding at 0 min, and 16 min later. Symbols mark site of the ZO-1 patch (open triangle), surrounding cells directly adjoining the shedding site (X) and more distant control cell (open circle). Scale bar = 5 μm. B: measurements from multiple experiments at the apical boundary of the epithelium (where neighboring cells express normal tight junctions). Symbols are the same as in A. Time 0 is defined as the time of losing a cell nucleus from the epithelial layer. ZO-1 patch is reduced in size over time (#P < 0.01 vs. adjacent cells at same time point; n = 15).
Fig. 5.
Fig. 5.
Comparison of en face and en profile measures of the space (gap) in the epithelial layer resulting from cell shedding. Cell nuclei were stained with Hoechst 33342. A: measurements made of the distance between the epithelial cell nuclei that are on either side flanking a shedding cell before, during, and after cell extrusion. In en face views, measured as linear distance between nuclei averaging values from three lines each crossing the center of the shedding cell to intersect a pair of nuclei in different flanking cells. In en profile view, measured as linear distance between the two nuclei flanking the shedding cell (as highlighted in B). Comparisons to the “before” condition in the same viewing orientation: ns, not significant. #P < 0.001, comparisons between viewing orientation in same time category; †P < 0.001. (n = 45 in total). B: yellow arrow identifies shedding cell in en profile view, and white lines and arrows demark distance between flanking nuclei surrounding the shedding cell. Inset: highlight of ZO-1 funnel.
Fig. 6.
Fig. 6.
Testing local permeability at sites of cell shedding using luminal Lucifer Yellow (LY). Images of Hoechst 33342 (blue), ZO-1 (red), and LY fluorescence (green) collected at indicated time points in a representative experiment. Each row of images are collected at a single time point. Left and middle, results overlaying all fluorescent reporters at two Z-axis focal depths (0 and 3 μm, respectively). Right, LY fluorescence alone (0 μm). LY fills the luminal space between villi, and the intercellular space progressing around the lateral sides of the shedding cell. Limit of LY permeation is always defined by site of condensed ZO-1 underneath the shedding cell. Scale bar = 5 μm.
Fig. 7.
Fig. 7.
Immunofluorescence staining of ZO-1 in shedding cells from normal mouse jejunum. As described in materials and methods, fixed tissue sections were stained for ZO-1 (red), actin (green), and cell nucleus (Hoechst, blue) and imaged by fluorescence microscopy. The figure shows results from four separate stages (AD) in which a Hoechst-stained cell nucleus was observed to be displaced from neighbors in the process of cell shedding. Each AD panel shows a series of images to highlight (from left to right) ZO-1, Hoechst, ZO-1/Hoechst overlay, and ZO-1/Hoechst/actin overlay. Scale bar = 10 μm.
Fig. 8.
Fig. 8.
Immunofluorescence staining of ezrin (A) and E-cadherin (B) in shedding cells from normal mouse jejunum. Fixed tissue sections were stained for ZO-1 (red), ezrin or E-cadherin (green), and Hoechst (blue) and imaged by fluorescence microscopy. *shedding cell. Scale bar = 10 μm.

References

    1. Baron DA, Miller DH. Extrusion of colonic epithelial cells in vitro. J Electron Microsc Tech 16: 15–24, 1990 - PubMed
    1. Bement WM, Mandato CA, Kirsch MN. Wound-induced assembly and closure of an actomyosin purse string in Xenopus oocytes. Curr Biol 9: 579–587, 1999 - PubMed
    1. Bullen TF, Forrest S, Campbell F, Dodson AR, Hershman MJ, Pritchard DM, Turner JR, Montrose MH, Watson AJ. Characterization of epithelial cell shedding from human small intestine. Lab Invest 86: 1052–1063, 2006 - PubMed
    1. Chen L, Park SM, Turner JR, Peter ME. Cell death in the colonic epithelium during inflammatory bowel diseases: CD95/Fas and beyond. Inflamm Bowel Dis 16: 1071–1076 - PubMed
    1. Clark AG, Miller AL, Vaughan E, Yu HY, Penkert R, Bement WM. Integration of single and multicellular wound responses. Curr Biol 19: 1389–1395, 2009 - PMC - PubMed

Publication types

LinkOut - more resources