. 2011 Apr;60(4):1258-69.
doi: 10.2337/db10-0916. Epub 2011 Feb 23.

Hyperuricemia as a mediator of the proinflammatory endocrine imbalance in the adipose tissue in a murine model of the metabolic syndrome

Affiliations

Hyperuricemia as a mediator of the proinflammatory endocrine imbalance in the adipose tissue in a murine model of the metabolic syndrome

William Baldwin et al. Diabetes. 2011 Apr.

Abstract

Objective: Hyperuricemia is strongly associated with obesity and metabolic syndrome and can predict visceral obesity and insulin resistance. Previously, we showed that soluble uric acid directly stimulated the redox-dependent proinflammatory signaling in adipocytes. In this study we demonstrate the role of hyperuricemia in the production of key adipokines.

Research design and methods: We used mouse 3T3-L1 adipocytes, human primary adipocytes, and a mouse model of metabolic syndrome and hyperuricemia.

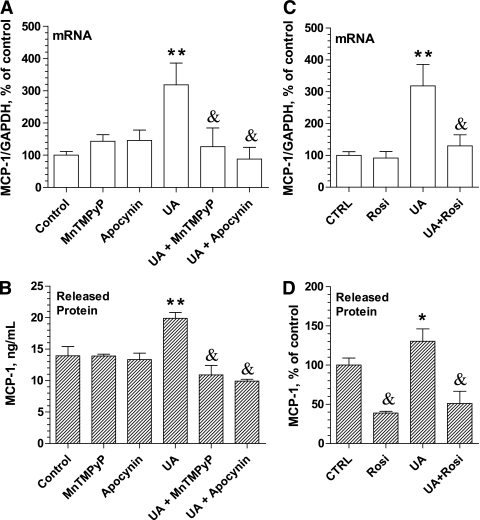
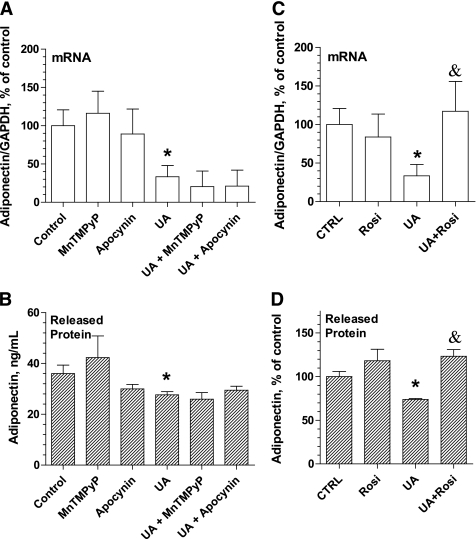
Results: Uric acid induced in vitro an increase in the production (mRNA and secreted protein) of monocyte chemotactic protein-1 (MCP-1), an adipokine playing an essential role in inducing the proinflammatory state in adipocytes in obesity. In addition, uric acid caused a decrease in the production of adiponectin, an adipocyte-specific insulin sensitizer and anti-inflammatory agent. Uric acid-induced increase in MCP-1 production was blocked by scavenging superoxide or by inhibiting NADPH oxidase and by stimulating peroxisome-proliferator-activated receptor-γ with rosiglitazone. Downregulation of the adiponectin production was prevented by rosiglitazone but not by antioxidants. In obese mice with metabolic syndrome, we observed hyperuricemia. Lowering uric acid in these mice by inhibiting xanthine oxidoreductase with allopurinol could improve the proinflammatory endocrine imbalance in the adipose tissue by reducing production of MCP-1 and increasing production of adiponectin. In addition, lowering uric acid in obese mice decreased macrophage infiltration in the adipose tissue and reduced insulin resistance.

Conclusions: Hyperuricemia might be partially responsible for the proinflammatory endocrine imbalance in the adipose tissue, which is an underlying mechanism of the low-grade inflammation and insulin resistance in subjects with the metabolic syndrome.


Figures

FIG. 1.
FIG. 1.
Effect of uric acid on the mRNA expression for MCP-1 and adiponectin in 3T3-L1 adipocytes: time course and dose response. Differentiated 3T3-L1 adipocytes were treated with different concentrations of uric acid for varying periods of time. Relative mRNA expression for the MCP-1 (A and B) and adiponectin (C and D) in the dose response (A and C) and time course (B and D) for the effects of uric acid are shown. The values are mean ± SEM for 3–5 independent experiments performed at least in duplicate. *P < 0.05 (nonparametric Mann-Whitney U test) in comparison with untreated differentiated adipocytes. d, days; CTRL, control; undif., undifferentiated.
FIG. 2.
FIG. 2.
Effect of the superoxide scavenger MnTMPyP and inhibitor of NADPH oxidase apocynin on the uric acid–induced increase in the mRNA expression and protein release for MCP-1 in 3T3-L1 adipocytes. 3T3-L1 adipocytes were incubated in the presence of 15 mg/dL uric acid with or without MnTMPyP (25 μmol/L, 30-min preincubation), apocynin (200 μmol/L), or rosiglitazone (10 μmol/L) for 7 days. Medium was changed once during this period with the fresh aliquot containing the same additives and stored at −80°C to pool with the medium collected at the end of the treatment. Total mRNA was isolated from the monolayer while media were used for measuring concentration of adipokines. The effect of uric acid in the presence or absence of antioxidants is shown in A for the relative expression of the mRNA for MCP-1 and in B for the concentration of MCP-1 in the pooled conditioned medium. The effect of rosiglitazone on the urate-stimulated MCP-1 production is shown in C (relative mRNA expression) and in D for the released protein. The values are mean ± SEM for three independent experiments performed in triplicate. *P < 0.05 and **P < 0.01 (nonparametric Mann-Whitney U test) in comparison with untreated adipocytes. &P < 0.05 (nonparametric Mann-Whitney U test) for the effect of an antioxidant/rosiglitazone. CTRL, control; Rosi, rosiglitazone; UA, uric acid.
FIG. 3.
FIG. 3.
Effect of the superoxide scavenger MnTMPyP and inhibitor of NADPH oxidase apocynin on the uric acid–induced decrease in the mRNA expression and protein release for adiponectin in 3T3-L1 adipocytes. The experimental conditions were as described in Fig. 2. The effect of uric acid in the presence or absence of antioxidants is shown in A for the relative expression of the mRNA for adiponectin and in B for the concentration of adiponectin in the pooled conditioned medium. The effect of rosiglitazone on the urate-stimulated adiponectin production is shown in C (relative mRNA expression) and D for the released protein. The values are mean ± SEM for three independent experiments performed in triplicate. *P < 0.05 (nonparametric Mann-Whitney U test) in comparison with untreated adipocytes. &P < 0.05 (nonparametric Mann-Whitney U test) for the effect of an antioxidant/rosiglitazone. CTRL, control; Rosi, rosiglitazone; UA, uric acid.
FIG. 4.
FIG. 4.
Hyperuricemia in the mouse model of metabolic syndrome. A: Blood levels of uric acid in several models of obesity, metabolic syndrome, and diabetes: the Pound mouse (obesity, metabolic syndrome, described in the research design and methods section) vs. lean (+/?) control; ZDF fa/fa rats (obesity, type 2 diabetes) vs. lean (+/?) control; ZSF obese vs. lean (+/?) control. B: Changes in the blood levels of uric acid in the lean and obese Pound mice during the course of the experiment and the effect of treatments with allopurinol. Allopurinol did not affect body weight in the lean animals (not shown). C: Time course for the body weight for lean and obese Pound mice treated with allopurinol. The values are mean ± SEM (N = 8–10, performed in duplicate). **P < 0.01 and ***P < 0.001 (U test) for the effect of obesity. ###P < 0.001 (U test) for the effect of allopurinol. Allop, allopurinol; CTRL, control.
FIG. 5.
FIG. 5.
The effect of lowering uric acid with allopurinol on the MCP-1 and adiponectin production in the adipose tissue of the obese Pound mice. Obese Pound mice and lean (+/?) control mice were treated with allopurinol for 8 weeks as described in the research design and methods section. mRNA abundance (A and C) as well as blood levels (B and D) for MCP-1 (A and B) and adiponectin (C and D) were measured at the end of the experiment. The values are mean ± SEM (N = 8–10, performed in duplicate). *P < 0.05 and ***P < 0.001 (U test), correspondingly, for the effect of obesity. &P < 0.05 for the effect of allopurinol.
FIG. 6.
FIG. 6.
The effect of lowering uric acid levels on the macrophage infiltration, TNF-α expression, and oxidative stress in the adipose tissue of the obese Pound mice. Samples of the adipose tissue from lean (A), obese (Pound) (B), and obese mice treated with allopurinol for 8 weeks (C) were stained with F4/80 antibody and counterstained with hematoxylin. Because diaminobenzidine was used as a chromogen, macrophages (F4/80-positive cells) are stained in brown as indicated with arrowheads (see also magnified rectangular region). D: The percentage of F4/80-positive macrophages within the adipose tissue is greatly induced by obesity and reduced by allopurinol treatment. Allopurinol did not affect macrophage staining in lean mice (not shown). Counting positive and negative cells were performed in a blind fashion at least in three fields per animal. E: Effect of allopurinol treatment on the relative expression of mRNA for TNF-α in the visceral adipose tissue of the obese (Pound) mice. In addition, the level of the oxidative stress in the serum (F) and in the visceral fat (G) in these mice was assessed by measuring the product of lipid peroxidation MDA using thiobarbituric acid reactive substance assay. The values are mean ± SEM (N = 5–6, performed in triplicate). **P < 0.01 and ***P < 0.001 (U test), correspondingly, for the effect of obesity. &P < 0.05 for the effect of allopurinol. WAT, white adipose tissue. (A high-quality digital representation of this figure is available in the online issue.)
FIG. 7.
FIG. 7.
Lowering uric acid levels in obese (Pound) mice improves signs of metabolic syndrome (insulin resistance, hypertension). A: To assess level of insulin sensitivity, the insulin tolerance test was used. Insulin (1 unit/kg) was injected, and blood level was measured at 0, 15, 30, 60, 90, and 120 min after injection. Sensitivity to insulin was normal in lean mice but dramatically reduced in obese mice, which was partially improved by treatment with allopurinol. B: Obesity induced increase in the MAP in mice, which was attenuated by allopurinol treatment. C: Representative recordings of blood pressure averaged in B. The values are mean ± SEM (N = 5–6, performed in triplicate). **P < 0.01 and ***P < 0.001 (U test), correspondingly, for the effect of obesity. ##P < 0.01 for the effect of allopurinol. Allo, allopurinol; CTRL, control. (A high-quality color representation of this figure is available in the online issue.)
FIG. 8.
FIG. 8.
Model for the effect of hyperuricemia on the endocrine balance in adipocytes. This model summarizes the results of the current and the previous (15) studies. Uric acid can enter adipocytes through a uric acid–specific transporter. We identified that adipocytes express at least one uric acid transporter, URAT1. Activation of NOX by uric acid occurs via unknown mechanism, and it was localized on the plasma membrane as well as on intracellular membranes. ROS generated from superoxide produced by NOX is followed by ROS-dependent activation of the proinflammatory signaling via p38. An activation of this mechanism in response to uric acid is followed by an increase in the production of MCP-1 and a decrease in the production of adiponectin. In addition, uric acid entering the adipocyte may downregulate expression of XOR, which (xanthine dehydrogenase but not xanthine oxidase) is known as a crucial upstream regulator of activity of PPAR-γ, a master-regulator of adipogenesis, expression of adiponectin, and an anti-inflammatory factor in adipocytes (38). Upregulation of MCP-1 in response to uric acid can be prevented by a superoxide scavenger or by inhibiting NOX. PPAR-γ activation can prevent both effects of uric acid. The effect of hyperuricemia might be partially responsible for the low-grade inflammation and insulin resistance in the adipose tissue and for increased risk of cardiovascular disease induced by obesity.

References

    1. Feig DI, Kang DH, Johnson RJ. Uric acid and cardiovascular risk. N Engl J Med 2008;359:1811–1821 - PMC - PubMed
    1. Johnson RJ, Segal MS, Srinivas T, et al. Essential hypertension, progressive renal disease, and uric acid: a pathogenetic link? J Am Soc Nephrol 2005;16:1909–1919 - PubMed
    1. Johnson RJ, Perez-Pozo SE, Sautin YY, et al. Hypothesis: could excessive fructose intake and uric acid cause type 2 diabetes? Endocr Rev 2009;30:96–116 - PMC - PubMed
    1. Matsuura F, Yamashita S, Nakamura T, et al. Effect of visceral fat accumulation on uric acid metabolism in male obese subjects: visceral fat obesity is linked more closely to overproduction of uric acid than subcutaneous fat obesity. Metabolism 1998;47:929–933 - PubMed
    1. Hikita M, Ohno I, Mori Y, Ichida K, Yokose T, Hosoya T. Relationship between hyperuricemia and body fat distribution. Intern Med 2007;46:1353–1358 - PubMed

Publication types