. 2011 Apr 15;22(8):1148-66.
doi: 10.1091/mbc.E10-08-0722. Epub 2011 Feb 23.

HIV-1 requires Arf6-mediated membrane dynamics to efficiently enter and infect T lymphocytes

Affiliations

HIV-1 requires Arf6-mediated membrane dynamics to efficiently enter and infect T lymphocytes

Laura García-Expósito et al. Mol Biol Cell. .

Abstract

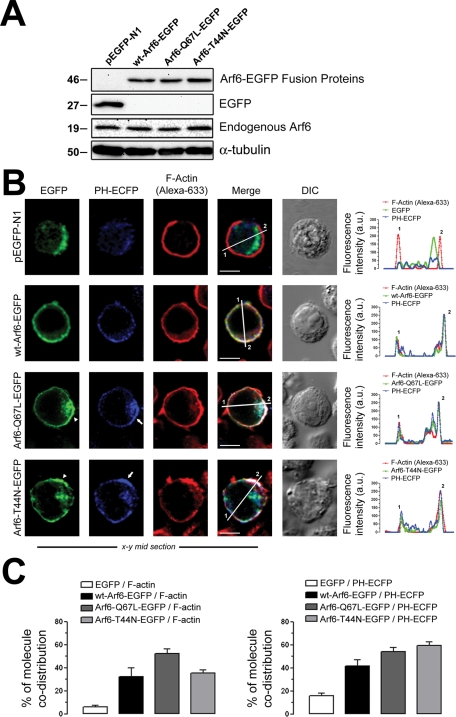
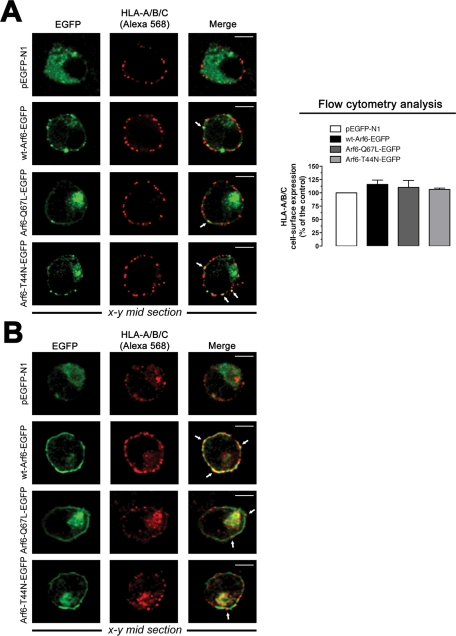
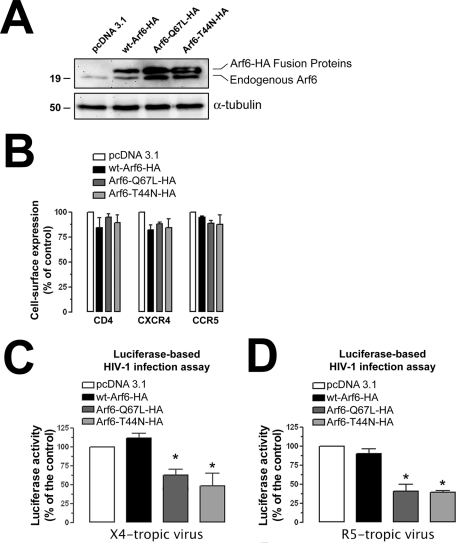
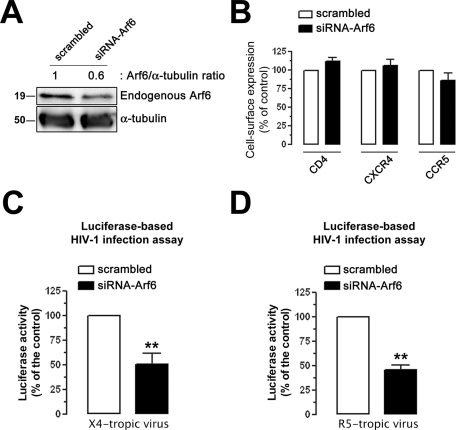
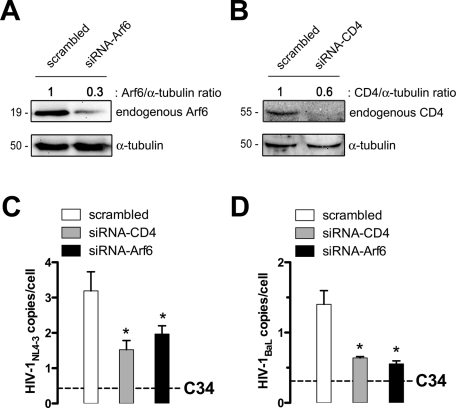
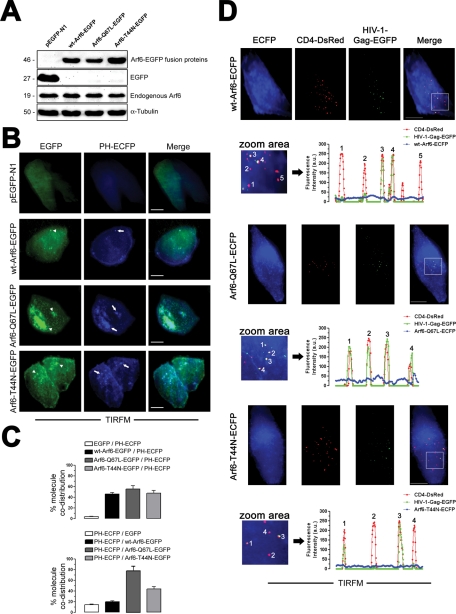
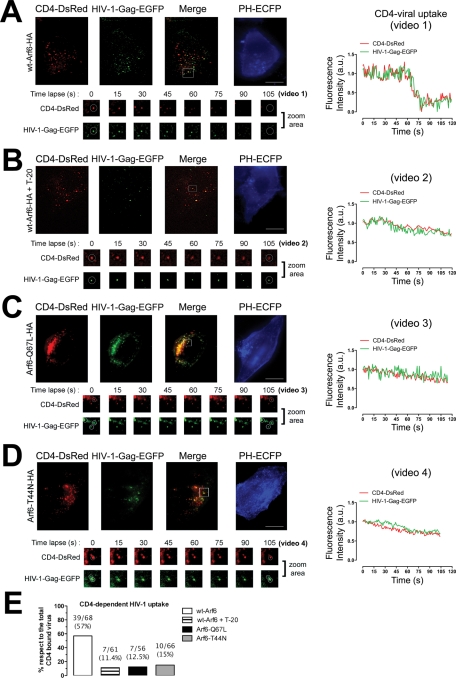
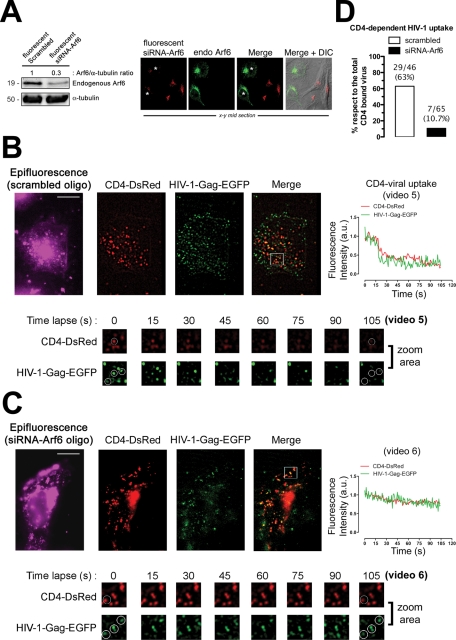
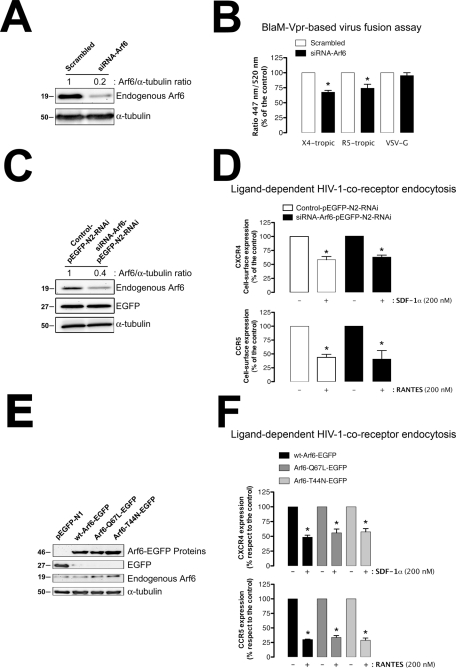
As the initial barrier to viral entry, the plasma membrane along with the membrane trafficking machinery and cytoskeleton are of fundamental importance in the viral cycle. However, little is known about the contribution of plasma membrane dynamics during early human immunodeficiency virus type 1 (HIV-1) infection. Considering that ADP ribosylation factor 6 (Arf6) regulates cellular invasion via several microorganisms by coordinating membrane trafficking, our aim was to study the function of Arf6-mediated membrane dynamics on HIV-1 entry and infection of T lymphocytes. We observed that an alteration of the Arf6-guanosine 5'-diphosphate/guanosine 5'-triphosphate (GTP/GDP) cycle, by GDP-bound or GTP-bound inactive mutants or by specific Arf6 silencing, inhibited HIV-1 envelope-induced membrane fusion, entry, and infection of T lymphocytes and permissive cells, regardless of viral tropism. Furthermore, cell-to-cell HIV-1 transmission of primary human CD4(+) T lymphocytes was inhibited by Arf6 knockdown. Total internal reflection fluorescence microscopy showed that Arf6 mutants provoked the accumulation of phosphatidylinositol-(4,5)-biphosphate-associated structures on the plasma membrane of permissive cells, without affecting CD4-viral attachment but impeding CD4-dependent HIV-1 entry. Arf6 silencing or its mutants did not affect fusion, entry, and infection of vesicular stomatitis virus G-pseudotyped viruses or ligand-induced CXCR4 or CCR5 endocytosis, both clathrin-dependent processes. Therefore we propose that efficient early HIV-1 infection of CD4(+) T lymphocytes requires Arf6-coordinated plasma membrane dynamics that promote viral fusion and entry.


Figures

FIGURE 1:
FIGURE 1:
Pattern of expression of endogenous Arf6 and Arf6-EGFP constructs on permissive lymphocytes. (A) Western blot analysis of endogenous Arf6, WT Arf6–, Arf6-Q67L–, and Arf6-T44N–EGFP expression in CEM-CCR5 cells. α-Tubulin and pEGFP-N1 are the controls for total protein and EGFP expression, respectively. (B) Left, a series of confocal images, x–y midsections, show the expression pattern for WT Arf6–, Arf6-Q67L–, and Arf6-T44N–EGFP molecules in CEM-CCR5 cells. PIP2 (PH-ECFP probe), F-actin (Alexa 633–labeled phalloidin), free EGFP distribution, and merged and differential interference contrast (DIC) images are shown. White arrowheads and arrows indicate Arf6 mutants and PH-ECFP plasma-membrane localization, respectively. Bar, 5 μm. Right, Arf6-EGFP constructs, F-actin, and PH-ECFP distribution were quantified along lines drawn through the diameter of the cells (1 and 2 indicate measurement points in merged pictures). (C) Codistribution quantification for each Arf6-EGFP construct or EGFP with F-actin (left) or with the PH-ECFP probe (right) in whole cells. Data are mean ± standard error of the mean (SEM) (n = 15 different cells).
FIGURE 2:
FIGURE 2:
Pattern of expression of Arf6-EGFP constructs and endogenous MHC-I molecules on permissive lymphocytes. (A) Left, a series of confocal images, x–y midsections, show the expression pattern for endogenous HLA-A/B/C molecules and overexpressed WT Arf6–, Arf6-Q67L–, and Arf6-T44N–EGFP constructs in nonpermeabilized CEM-CCR5 cells. Free EGFP distribution and merged images are shown. White arrows indicate Arf6-EGFP constructs and HLA-A/B/C codistribution at cell surface. Bar, 5 μm. Right, flow cytometry analysis of HLA-A/B/C cell-surface expression in Arf6-EGFP–transfected cells (control, 100% HLA-A/B/C expression in pEGFP-N1–transfected cells). Data are mean ± SEM, n = 9. (B) A series of confocal images, x–y midsections, show the expression pattern for endogenous HLA-A/B/C and overexpressed WT Arf6–, Arf6-Q67L–, and Arf6-T44N–EGFP constructs in permeabilized CEM-CCR5 cells. Free EGFP distribution and merged images are shown. Bar, 5 μm.
FIGURE 3:
FIGURE 3:
Effect of the Arf6 constructs on HIV-1 entry and infection in permissive lymphocytes. (A) Western blot analysis of endogenous Arf6, WT Arf6–, Arf6-Q67L–, and Arf6-T44N–HA expression in CEM-CCR5 cells. α-Tubulin and pcDNA 3.1 are the controls for total protein and transfected cells, respectively. A representative experiment of the three is shown. (B) Flow cytometry analysis of CD4, CXCR4, and CCR5 cell-surface expression in Arf6-HA–transfected cells. Data are mean ± SEM, n = 9. (C and D) Luciferase-based assay of viral entry and infection by nonreplicative X4- and R5-tropic HIV-1 viral particles, respectively, in Arf6-HA–transfected CEM-CCR5 cells (control, 100% viral entry and infection in pcDNA3.1-transfected cells). Data are mean ± SEM of three independent experiments carried out in triplicate. Asterisk indicates p < 0.05, t test.
FIGURE 4:
FIGURE 4:
Effect of different Arf6 constructs and the EFA6 factor on HIV-1 entry and infection in permissive lymphocytes. (A) Western blot analysis of endogenous Arf6, Arf6-N48I/Q67L, and Arf6-T27NHA expression in CEM-CCR5 cells. α-Tubulin and pcDNA 3.1 are the controls for total protein and transfected cells, respectively. A representative experiment of the three is shown. (B) Luciferase-based assay of viral entry and infection by nonreplicative X4- and R5-tropic HIV-1 viral particles, respectively, in Arf6-N48I/Q67L and Arf6-T27NHA–transfected CEM-CCR5 cells (control, 100% viral entry and infection in pcDNA3.1-transfected cells). Data are mean ± SEM of three independent experiments carried out in triplicate. Asterisk indicates p < 0.05, t test. (C) Western blot analysis of endogenous Arf6, WT Arf6–HA, and vsv-g-EFA6 expression in CEM-CCR5 cells. α-Tubulin and pcDNA 3.1 are the controls for total protein and transfected cells, respectively. A representative experiment of the three is shown. (D) Luciferase-based assay of viral entry and infection by nonreplicative X4- and R5-tropic HIV-1 viral particles, respectively, in WT Arf6–HA, vsv-g-EFA6, and double WT Arf6–HA/vsv-g-EFA6–transfected CEM-CCR5 cells (control, 100% viral entry and infection in pcDNA3.1-transfected cells). Data are mean ± SEM of three independent experiments carried out in triplicate.
FIGURE 5:
FIGURE 5:
Effect of knockdown of the endogenous Arf6 protein on HIV-1 entry and infection in permissive lymphocytes. (A) Western blot analysis of endogenous Arf6 knockdown in siRNA-Arf6–treated CEM-CCR5 cells, quantified as the band intensity ratios to α-tubulin. A representative experiment of three is shown. (B) Flow cytometry analysis of CD4, CXCR4, and CCR5 cell-surface expression in scrambled- or siRNA-Arf6–treated CEM-CCR5 cells. Data are the mean ± SEM of three independent experiments carried out in triplicate. (C and D) Luciferase-based assay of viral entry and infection by nonreplicative X4- and R5-tropic HIV-1 viral strains, respectively, in siRNA-Arf6–silenced CEM-CCR5 cells (control, 100% viral entry in scrambled-treated cells). Data are mean ± SEM of three independent experiments carried out in triplicate. Asterisks indicate p < 0.01, t test.
FIGURE 6:
FIGURE 6:
Effect of Arf6 silencing on cell-to-cell HIV-1 transmission and infection of primary CD4+ T-cells. (A and B) Western blot analysis of Arf6 and CD4 knockdown in specific siRNA- or scrambled-nucleofected human primary CD4+ T-cells, 24 h after nucleofection, quantified as the band intensity ratios to α-tubulin. A representative experiment of three is shown. (C and D) After 24 h, nucleofected unstimulated primary CD4+ T-cells were cocultured with (C) MOLTNL4-3 or (D) MOLTBaL cells. Cell-to-cell HIV-1 transmission was analyzed at 24 h postcoculture by real-time PCR using a standard curve of a known number of HIV and CCR5 copies. Data represented HIV-1 DNA copies per cell, as values were normalized to the copy number of CCR5. Dashed lines represent the background levels of HIV-1 DNA in MOLT cells as determined in control cocultures in the presence of the fusion inhibitor peptide C34. Data are mean ± SD of three independent experiments. Asterisks indicate p < 0.05, t test.
FIGURE 7:
FIGURE 7:
TIRFM analysis for plasma membrane expression pattern of Arf6-EGFP or Arf6-ECFP constructs, and free or HIV-1–bound CD4-DsRed molecules on permissive HeLa cells. (A) Western blot analysis of endogenous Arf6, WT Arf6–, Arf6-Q67L–, and Arf6-T44N–EGFP expression in permissive TZMbl cells. α-Tubulin is the control for total protein. Free EGFP protein expression in pEGFP-N1–transfected cells. A representative experiment of the three is shown. (B) TIRFM analysis for the plasma membrane expression pattern of each Arf6-EGFP and the PH-ECFP probe. Merged images are shown. A representative experiment of the three is shown. Bar, 5 μm. White arrowheads or arrows indicate the distribution of Arf6 mutant or accumulation of PIP2-associated structures, respectively. (C) Quantification of the codistribution of each Arf6-EGFP or free EGFP molecule with PIP2 (PH-ECFP)–associated plasma membrane structures (top) or PIP2 (PH-ECFP) with each Arf6-EGFP or free EGFP molecule (bottom) from TIRFM images, as shown in (B). A representative experiment of three is shown. (D) A series of TIRFM images representing the expression pattern of cell-surface CD4-DsRed, HIV-1–Gag-EGFP virions, CD4-attached HIV-1–Gag-EGFP virions (merge), and WT Arf6–, Arf6-Q67L–, or Arf6-T44N–ECFP constructs, respectively, at the EF of TZMbl cells. The quantification of the pattern of distribution of free or HIV-1–Gag-EGFP–bound CD4-DsRed or Arf6-ECFP constructs is shown by line scan quantification, after background remove, through regions 1–4 or 5 indicated in zoom areas. Bar, 5 μm.
FIGURE 8:
FIGURE 8:
Effects of the different Arf6-HA constructs on PIP2–plasma membrane distribution and HIV-1 entry analyzed by TIRFM. (A–D) A series of TIRFM images representing the expression pattern of cell-surface CD4-DsRed, HIV-1–Gag-EGFP virions, CD4-attached HIV-1–Gag-EGFP virions (merge), and the PH-ECFP probe (readout for PIP2) at the EF of TZMbl cells, under any experimental condition. T-20 treatment represents a control for the blockade of CD4-dependent fusogenic viral entry. White squares in merged images show a representative area (zoom area) where CD4-dependent HIV-1 uptake or blockade was observed, corresponding to Supplemental Videos 1–4, and a time lapse series of images (105 s, zoom area), under any experimental condition. White open circles, in a time lapse series of images, show representative events for CD4-dependent viral uptake or inhibition analyzed by time for their fluorescence intensities (right curves). Bar, 5 μm. (E) Histograms show the percentage of bound HIV-1–Gag-EGFP particles to CD4-DsRed that entered seven cells (ratio of CD4-dependent viral uptake events to the total number of CD4/HIV-1 interactions analyzed appears above the histograms), under any experimental condition.
FIGURE 9:
FIGURE 9:
Effect of endogenous Arf6 knockdown on HIV-1 entry in TZMbl cells analyzed by TIRFM. (A) Left, Western blot analysis of endogenous Arf6 knockdown, 24 h after fluorescent-siRNA nucleofection of TZMbl cells, quantified as the band intensity ratios to α-tubulin. Fluorescent scrambled oligonucleotides represent the negative control for RNAi. A representative experiment of three is shown. Right, a series of x–y midsection images showing the specific silencing of endogenous Arf6 (green) by fluorescent siRNA-Arf6 oligonucleotides (red). Asterisks indicate cells where Arf6 was not silenced. Merge and merge/DIC images are shown from a representative experiment. (B and C) A series of TIRFM images indicating cell-surface CD4-DsRed, HIV-1–Gag-EGFP virions, and CD4-attached HIV-1–Gag-EGFP virions (merge) at the EF of TZMbl, both in scrambled- or siRNA-Arf6–transfected cells. Fluorescent scrambled or siRNA-Arf6 oligonucleotides are monitored by epifluorescence. White squares in the merged images show a representative area (zoom area) where CD4-dependent HIV-1 uptake or blockade was observed, corresponding to Supplemental Videos 5 and 6, and a time lapse series of images (105 s, zoom area). Bar 5 μm. White open circles, in a time lapse series of images, show representative events for CD4-dependent viral uptake or inhibition, analyzed by time for their fluorescence intensities (right curves). (D) Histograms show the percentage of bound HIV-1–Gag-EGFP particles to CD4-DsRed that entered seven cells (ratio of CD4-dependent viral uptake events to the total number of CD4/HIV-1 interactions analyzed appears above the histograms), under any experimental condition.
FIGURE 10:
FIGURE 10:
Arf6 regulates HIV-1 viral fusion with CD4+ lymphocytes, without affecting CCR5 and CXCR4 internalization. (A) Western blot analysis of endogenous Arf6 knockdown 24 h after siRNA nucleofection of CEM-CCR5 cells, quantified as the band intensity ratios to α-tubulin. Scrambled oligonucleotides represent the negative control for RNAi. A representative experiment of three is shown. (B) Specific silencing of endogenous Arf6 specifically affects the early steps of viral infection. Control (scrambled)– or siRNA-Arf6–treated CEM-CCR5 cells were incubated for 3 h with equivalent viral inputs (determined by standard p24-ELISA) of X4-tropic or R5-tropic pNL4-3.Luc.R-E- virions containing the BlaM-Vpr fusion protein. After adsorption for 3 h, cells were treated with CCF2-AM and analyzed by fluorescence spectrophotometry after 16 h. VSV-G virions containing the BlaM-Vpr fusion protein were used to control the specificity of Arf6-mediated effects on HIV-1 viral fusion. The percentages of HIV-1–fused cells were determined by measuring the ratio of blue (447 nm; cleaved CCF2) to green (520 nm; intact CCF2) fluorescence signals in target cells. Each assay was done in triplicate, and results are representative of three independent experiments. (C) Western blot analysis of endogenous Arf6 knockdown, 24 h after control- or siRNA-Arf6–pEGFP-N2-RNAi nucleofection of CEM-CCR5 cells, quantified as the band intensity ratios to α-tubulin. Control and siRNA oligonucleotides were transfected using the pEGFP-N2-RNAi plasmid; therefore treated cells expressed the EGFP protein, which serves as a control of cell treatment. A representative experiment of three is shown. (D) Effect of Arf6 knockdown on ligand-induced CXCR4 (SDF-1α) and CCR5 (RANTES) endocytosis in CEM-CCR5 cells. Control or siRNA-Arf6–pEGFP-N2-RNAi–treated cells were exposed to SDF-1α (200 nM) or RANTES (200 nM) for 1 h at 37°C. Then CXCR4 or CCR5 expression was analyzed by flow cytometry in control/EGFP+ and siRNA-Arf6/EGFP+ cells using PE-conjugated specific mAbs against cell-surface CXCR4 or CCR5. Data are mean ± SEM of three independent experiments carried out in triplicate and refer to CXCR4 or CCR5 expression in the absence of SDF-1α or RANTES, respectively, taken as 100%. Asterisk indicates p < 0.05, t test. (E) Western blot analysis of endogenous Arf6, WT Arf6–, Arf6-Q67L–, and Arf6-T44N–EGFP expression in CEM-CCR5 cells. α-Tubulin and pEGFP-N1 are the controls for total protein and intact Arf6-EGFP expression, respectively. (F). Effect of different Arf6-EGFP constructs on ligand-induced CXCR4 (SDF-1α) and CCR5 (RANTES) endocytosis in CEM-CCR5 cells. The experiments were carried out as indicated in (D) but in cells overexpressing each Arf6-EGFP construct. Data are mean ± SEM of three independent experiments carried out in triplicate and refer to cell-surface CXCR4 or CCR5 expression in WT Arf6–EGFP–transfected cells in the absence of SDF-1α or RANTES, respectively, taken as 100%. Asterisk indicates p < 0.05, t test.

Similar articles

Cited by

References

    1. Aikawa Y, Martin TF. ADP-ribosylation factor 6 regulation of phosphatidylinositol-4,5-bisphosphate synthesis, endocytosis, and exocytosis. Methods Enzymol. 2005;404:422–431. - PubMed
    1. Al-Awar O, Radhakrishna H, Powell NN, Donaldson JG. Separation of membrane trafficking and actin remodeling functions of ARF6 with an effector domain mutant. Mol Cell Biol. 2000;20:5998–6007. - PMC - PubMed
    1. Albertson R, Riggs B, Sullivan W. Membrane traffic: a driving force in cytokinesis. Trends Cell Biol. 2005;15:92–101. - PubMed
    1. Barral DC, Cavallari M, McCormick PJ, Garg S, Magee AI, Bonifacino JS, De Libero G, Brenner MB. CD1a and MHC class I follow a similar endocytic recycling pathway. Traffic. 2008;9:1446–1457. - PMC - PubMed
    1. Barrero-Villar M, Barroso-Gonzalez J, Cabrero JR, Gordon-Alonso M, Alvarez-Losada S, Munoz-Fernandez MA, Sanchez-Madrid F, Valenzuela-Fernandez A. PI4P5-kinase Iα is required for efficient HIV-1 entry and infection of T-cells. J Immunol. 2008;181:6882–6888. - PubMed

Publication types

MeSH terms