. 2011 Apr 15;22(8):1409-19.
doi: 10.1091/mbc.E10-10-0821. Epub 2011 Feb 23.

PKCθ signaling is required for myoblast fusion by regulating the expression of caveolin-3 and β1D integrin upstream focal adhesion kinase

Affiliations

PKCθ signaling is required for myoblast fusion by regulating the expression of caveolin-3 and β1D integrin upstream focal adhesion kinase

Luca Madaro et al. Mol Biol Cell. .

Abstract

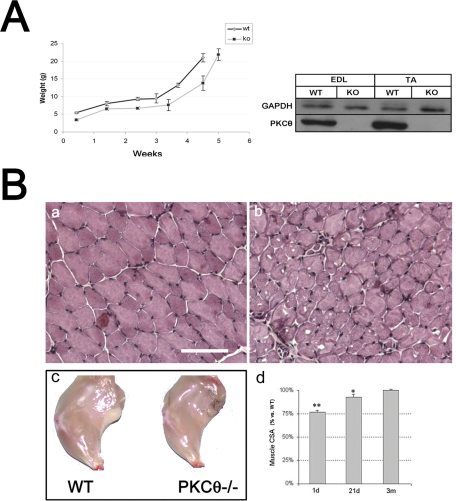
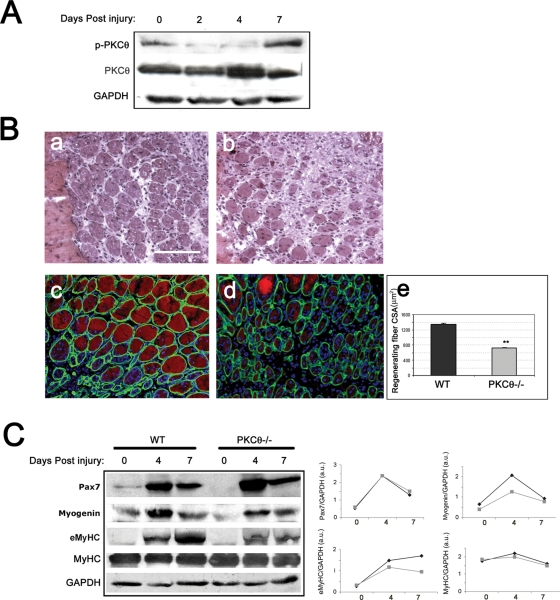
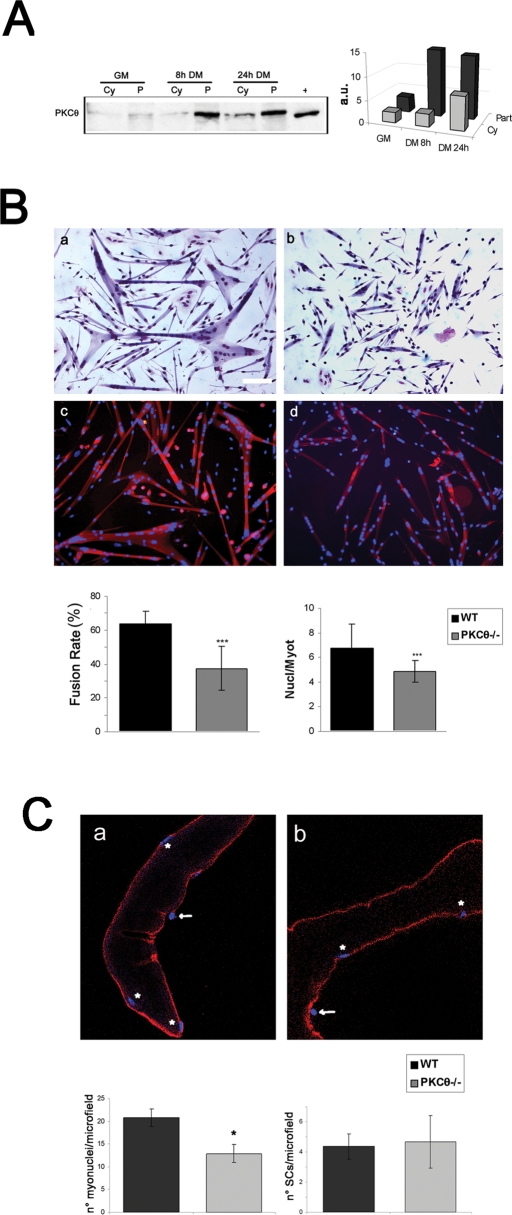
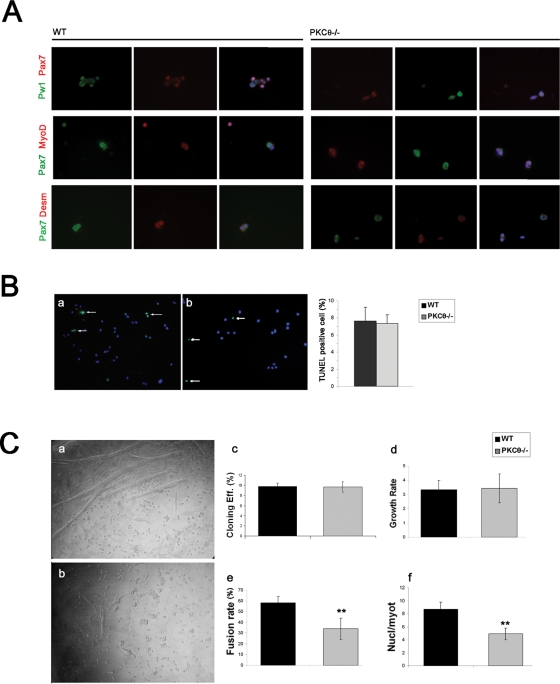
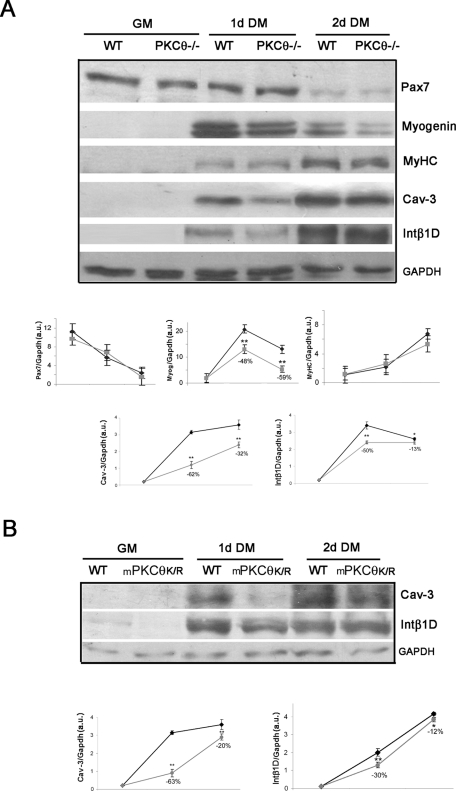
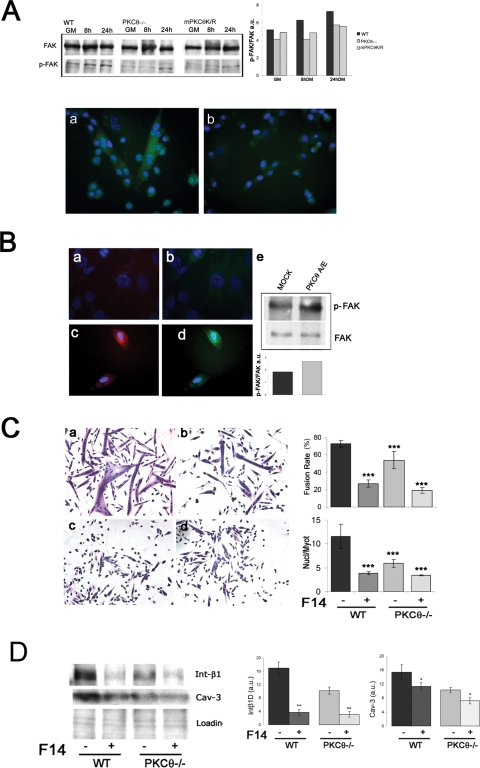
Fusion of mononucleated myoblasts to form multinucleated myofibers is an essential phase of skeletal myogenesis, which occurs during muscle development as well as during postnatal life for muscle growth, turnover, and regeneration. Many cell adhesion proteins, including integrins, have been shown to be important for myoblast fusion in vertebrates, and recently focal adhesion kinase (FAK), has been proposed as a key mediator of myoblast fusion. Here we focused on the possible role of PKC, the PKC isoform predominantly expressed in skeletal muscle, in myoblast fusion. We found that the expression of PKC is strongly up-regulated following freeze injury-induced muscle regeneration, as well as during in vitro differentiation of satellite cells (SCs; the muscle stem cells). Using both PKC knockout and muscle-specific PKC dominant-negative mutant mouse models, we observed delayed body and muscle fiber growth during the first weeks of postnatal life, when compared with wild-type (WT) mice. We also found that myofiber formation, during muscle regeneration after freeze injury, was markedly impaired in PKC mutant mice, as compared with WT. This phenotype was associated with reduced expression of the myogenic differentiation program executor, myogenin, but not with that of the SC marker Pax7. Indeed in vitro differentiation of primary muscle-derived SCs from PKC mutants resulted in the formation of thinner myotubes with reduced numbers of myonuclei and reduced fusion rate, when compared with WT cells. These effects were associated to reduced expression of the profusion genes caveolin-3 and β1D integrin and to reduced activation/phosphorylation of their up-stream regulator FAK. Indeed the exogenous expression of a constitutively active mutant form of PKC in muscle cells induced FAK phosphorylation. Moreover pharmacologically mediated full inhibition of FAK activity led to similar fusion defects in both WT and PKC-null myoblasts. We thus propose that PKC signaling regulates myoblast fusion by regulating, at least in part, FAK activity, essential for profusion gene expression.


Figures

FIGURE 1:
FIGURE 1:
Lack of PKCθ delays mice growth. (A) Mean body weight in WT and PKCθ−/– mice at different time points during postnatal growth (left panel) (n ≥ 5 per genotype/age). Right panel, Western blot analysis of PKCθ expression in EDL and TA muscle from 2-mo-old WT and PKCθ−/– mice. (B) H&E staining of TA muscle sections from 2-mo-old WT (a) and PKCθ−/– mice (b) (bar = 100 μm); c: representative picture of hind limbs derived from 2-mo-old WT and PKCθ−/– mice, as indicated; d: mean myofiber CSA in PKCθ−/– (gray bars) TA muscles at different periods of time during postnatal growth, expressed as percentage of myofiber CSA in WT, assumed as 100% for each time point; n ≥ 3 per genotype/age (**p < 0.01, *p < 0.05 vs. time-matched WT).
FIGURE 2:
FIGURE 2:
Lack of PKCθ impairs muscle regeneration in vivo. (A) Western blot analysis of total protein fractions from TA muscle at different periods of time after freeze injury in WT mice; the blot was incubated with the anti–phosphoThr538 PKCθ (p-PKCθ) and with the anti-PKCθ antibodies, as indicated; GAPDH level of expression was used for normalization. Representative experiment is shown (n = 3 per genotype). (B) Representative images of H&E staining (a and b) of TA cryosections obtained from 2-mo-old WT (a) and PKCθ−/– (b) mice at day 7 after freeze injury (n ≥ 3 per genotype). Double immunofluorescence analysis (c and d) of TA muscle cryosections at day 7 after freeze injury for laminin (green) and eMyHC (red) expression in WT (c) and PKCθ−/– (d) (bar = 100 μm). Mean CSA of eMyHC-expressing (regenerating) myofibers in WT (black bar) and PKCθ−/– 7 d after freeze injury (n = 3 per genotype; ***p < 0.001 vs. WT). (C) Western blot analysis of total protein fractions from WT and PKCθ−/– regenerating TA muscle 2, 4, and 7 d after freeze injury, as indicated. Representative blot from three independent experiments is shown (n = 3 per genotype at each time point); the blot was incubated with the α-Pax7, or -myogenin, or -eMyHC or -sarcomeric-MyHC (MyHC) antibodies, as indicated. GAPDH level of expression was used for normalization. Densitometric analysis is shown at the right.
FIGURE 3:
FIGURE 3:
Lack of PKCθ inhibits myotube growth in vitro. (A) Western blot analysis of both cytosolic (Cy) and particulate (P) subcellular protein fractions of primary SCs derived from WT muscle cultured in GM or in DM for the indicated periods of time; the blot was incubated with the α-PKCθ antibody. Representative experiment is shown (n = 3 per genotype). Whole muscle protein lysate was used as positive control (+). Densitometric analysis is shown at the right. (B) Representative Wright staining (a and b) and immunofluorescence analysis of MyHC expression (c and d) of WT (a and c)- and PKCθ−/– (b and d)-derived muscle SCs, cultured in DM for 48 h. Cells in c and d were counterstained with Hoechst; bar = 100 μm. Bottom panel: fusion rate is shown at the left, determined as the percentage of nuclei included in myotubes (containing ≥ 3 nuclei), with respect to the total number of nuclei; the mean number of nuclei contained within each myotube is also shown at the right (WT = black bar; PKCθ−/– = gray bar). The data were collected from at least five independent experiments (***p < 0.001 vs. WT). (C) Representative z section images of immunofluorescence analysis of myofibers isolated from WT (a) or PKCθ−/– (b) EDL muscle, immunostained with the α-caveolin-3 antibody (red, used as sarcolemma marker). Nuclei were counterstained with TO-PRO-3; asterisks indicate myonuclei included within sarcolemma, arrows indicate nuclei of associated SCs, outside the sarcolemma. At least 10 myofibers per mouse were analyzed (n = 3 per genotype). Each myofiber was analyzed under confocal microscopy, and the number of myonuclei in each microfield was counted for the entire thickness of the myofiber, taking pictures every 5 μm z section (shown in Supplemental Figure S1). The mean number of nuclei and of SCs is shown at the bottom (WT, black bars; PKCθ−/–, gray bars).
FIGURE 4:
FIGURE 4:
Lack of PKCθ inhibits myoblast fusion. (A) Immunofluorescence analysis of freshly isolated cells derived from WT or PKCθ−/– hind limb muscle, as indicated. The cells were immunolabeled with the α-Pax7, -PW1, -MyoD, or -desmin antibodies, as indicated. (B) Representative microimages of TUNEL analysis in WT (a) and PKCθ−/– (b) muscle-derived cells cultured in GM. The number of TUNEL-positive nuclei divided by the total number of nuclei in WT (black bar) or PKCθ−/– (gray bar) is shown at the right (20 microfields per genotype, from three independent experiments). (C) Representative phase contrast images of clonally cultured muscle-derived SCs from WT (a) and PKCθ−/– (b) after 6 d in DM; c: cloning efficiency, expressed as the percentage of clones obtained divided by the total number of plated cells; d: growth rate, expressed as the mean fold increase in cell number within a single clone (15 clones per genotype); e: fusion index, expressed as the percentage of nuclei included in myotubes (containing ≥ 3 nuclei), with respect to the total number of nuclei, within a single clone cultured for 6 d in DM (20 clones per genotype); f: mean number of nuclei included in each myotube within a single clone cultured for 6 d in DM (20 clones per genotype). WT = black bar; PKCθ−/– = gray bar; **p < 0.01 vs. WT.
FIGURE 5:
FIGURE 5:
Lack of PKCθ expression or activity prevents up-regulation of caveolin-3 and β1D-integrin expression. (A) Western blot analysis of WT and PKCθ−/– muscle-derived SCs, cultured in GM, or for different periods of time in DM, as indicated. Representative experiment is shown of three independent experiments. The blot was incubated with the α-Pax7, α-myogenin, α-sarcomeric myosin heavy chain, α-caveolin-3, and α-β1D integrin antibodies. The level of expression of each protein in both genotypes, determined by densitometric analysis using the α-GAPDH antibody for normalization, is shown at the bottom; WT (♦), PKCθ−/– (▪). (B) Western blot analysis of WT and mPKCθK/R muscle-derived cells, cultured in GM, or for different periods of time in DM, as indicated. The blot was incubated with the α-caveolin-3 and α-β1D integrin antibodies. Densitometric analysis is shown at the bottom, WT (♦) and mPKCθK/R (▪), using the α-GAPDH antibody for normalization as in A (**p < 0.01, *p < 0.05 vs. WT). When significant, reduction of expression in PKCθ−/– or in mPKCθK/R cells, expressed as percentage vs. WT (assumed as 100%) is also shown, resulting from at least three independent experiments.
FIGURE 6:
FIGURE 6:
PKCθ expression/activity is required for FAK phosphorylation. (A) Western blot analysis of WT, PKCθ−/–, and mPKCθK/R muscle-derived SCs, cultured in GM or for different periods of time in DM, as indicated. The blot was incubated with the α-FAK or with the α-phospho FAK antibodies. Representative experiment is shown of three independent experiments. Level of activation, determined by densitometric analysis as the phospho/total FAK ratio, is shown at the right. Representative immunofluorescence analysis of WT (a) or PKCθ−/– (b) muscle-derived cells cultured for 24 h in DM and incubated with the α-phospho FAK antibody is shown at the bottom. (B) Double immunofluorescence analysis of mock-transfected (a and b) or PKCθA/E-transfected (c and d) C2C12 cells using the α-PKCθ (red) and the α-pFAK (green) antibodies; e: Western blot analysis of mock-transfected or PKCθA/E-transfected C2C12 cells immunoprecipitated with the α-FAK antibody and incubated with the α-pFAK or the α-FAK antibodies. Representative experiment is shown of three independent experiments. Level of activation was determined by densitometric analysis, as the phospho/total FAK ratio. (C) Representative Wright staining of WT (a and c) or PKCθ−/– (b and d) muscle-derived primary cells cultured for 24 h in DM, in the absence (a and b) or presence (c and d) of the FAK inhibitor 14 (F14, 5 μM). Fusion rate, evaluated in each condition, is shown at the right, determined as the percentage of nuclei included in myotubes (containing ≥ 3 nuclei), with respect to the total number of nuclei; the mean number of nuclei contained within each myotube is also shown (WT = black bars; PKCθ−/– = gray bars). (D) Western blot analysis of the expression of caveolin-3 and β1D integrin in cells cultured as in C. Densitometric analysis is shown at the right; Red Ponceau staining of the membrane is shown to ensure equal loading. Representative experiment is shown of two independent experiments.

Similar articles

Cited by

References

    1. Abmayr SM, Balagopalan L, Galletta BJ, Hong SJ. Cell and molecular biology of myoblast fusion. Int Rev Cytol. 2003;225:33–89. - PubMed
    1. Aulino P, et al. Molecular, cellular and physiological characterization of the cancer cachexia-inducing C26 colon carcinoma in mouse. BMC Cancer. 2010;10:363. - PMC - PubMed
    1. Beierle EA, Ma X, Stewart J, Nyberg C, Trujillo A, Cance WG, Golubovskaya VM. Inhibition of focal adhesion kinase decreases tumor growth in human neuroblastoma. Cell Cycle. 2010;9:1005–1015. - PMC - PubMed
    1. Belkin AM, Zhidkova NI, Balzac F, Altruda F, Tomatis D, Maier A, Tarone G, Koteliansky VE, Burridge K. Beta 1D integrin displaces the beta 1A isoform in striated muscles: localization at junctional structures and signaling potential in nonmuscle cells. J Cell Biol. 1996;132:211–226. - PMC - PubMed
    1. Boschelli DH. Small molecule inhibitors of PKCTheta as potential antiinflammatory therapeutics. Curr Top Med Chem. 2009;9:640–654. - PubMed

Publication types

MeSH terms