Comparative Study
. 2011 Mar 21;56(6):1755-73.
doi: 10.1088/0031-9155/56/6/015. Epub 2011 Feb 23.

Comparison of blood velocity measurements between ultrasound Doppler and accelerated phase-contrast MR angiography in small arteries with disturbed flow

Affiliations
Comparative Study

Comparison of blood velocity measurements between ultrasound Doppler and accelerated phase-contrast MR angiography in small arteries with disturbed flow

Jingfeng Jiang et al. Phys Med Biol. .

Abstract

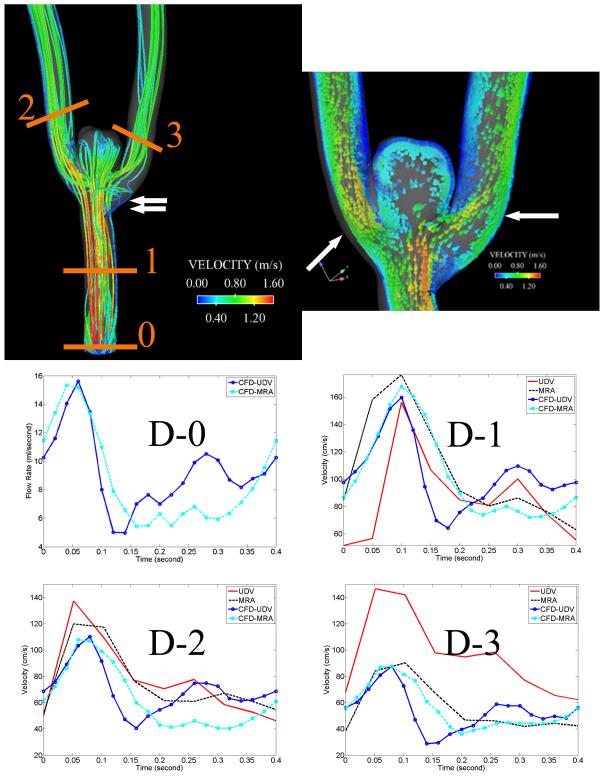
Ultrasound Doppler (UD) velocity measurements are commonly used to quantify blood flow velocities in vivo. The aim of our work was to investigate the accuracy of in vivo spectral Doppler measurements of velocity waveforms. Waveforms were derived from spectral Doppler signals and corrected for intrinsic spectral broadening errors by applying a previously published algorithm. The method was tested in a canine aneurysm model by determining velocities in small arteries (3-4 mm diameter) near the aneurysm where there was moderately disturbed flow. Doppler results were compared to velocity measurements in the same arteries acquired with a rapid volumetric phase contrast MR angiography technique named phase contrast vastly undersampled isotropic projection reconstruction magnetic resonance angiography (PC-VIPR MRA). After correcting for intrinsic spectral broadening, there was a high degree of correlation between velocities obtained by the real-time UD and the accelerated PC-MRA technique. The peak systolic velocity yielded a linear correlation coefficient of r = 0.83, end diastolic velocity resulted in r = 0.81, and temporally averaged mean velocity resulted in r = 0.76. The overall velocity waveforms obtained by the two techniques were also highly correlated (r = 0.89 ± 0.06). There were, however, only weak correlations for the pulsatility index (PI: 0.25) and resistive index (RI: 0.14) derived from the two techniques. Results demonstrate that to avoid overestimations of peak systolic velocities, the results for UD must be carefully corrected to compensate for errors caused by intrinsic spectral broadening.


Figures

Figure A1
Figure A1
A plot of Ultrasound Doppler velocity measurements (solid line) and manufacture provided conversion curve (dashed line) under various steady flow rates ranging from 2 to 13 5 ml/s. The error bar represents one standard deviation of measurement errors.
Figure 1
Figure 1
A bifurcation aneurysm (BA) and a side-wall aneurysm (SA) in a canine model. The left image shows the reconstructed geometry based on 3D digital subtraction angiography (DSA), while the right image is a matched power Doppler image overlaid onto a B-mode Ultrasound image. CCA in both images stands for the common carotid artery. Sections 1-4 are approximately four planes where UD measurements were made in this animal. The 3D DSA data were obtained using a clinical angiographic C-arm device (Axiom Artis dBA, Siemens Medical System Inc., Forchheim, Germany). Since the ultrasound scanning plane was set to visualize the bifurcation aneurysm, the side-wall aneurysm is not seen well in the right image.
Figure 2
Figure 2
Schematic illustrations of off-line processing of velocity waveforms: (a) UD Velocity Spectrogram and (b) 4D/3D PC-VIPR MRA. In (a), the red line with diamond markers and the blue line with triangle markers are the outer and inner velocity waveforms, respectively. Both lines are used in Eqn. (1). In (b), a MRA velocity waveform obtained from a matched imaging plane (slice thickness 0.8-mm) is displayed.
Figure 2
Figure 2
Schematic illustrations of off-line processing of velocity waveforms: (a) UD Velocity Spectrogram and (b) 4D/3D PC-VIPR MRA. In (a), the red line with diamond markers and the blue line with triangle markers are the outer and inner velocity waveforms, respectively. Both lines are used in Eqn. (1). In (b), a MRA velocity waveform obtained from a matched imaging plane (slice thickness 0.8-mm) is displayed.
Figure 3
Figure 3
Plots of velocity waveforms among Subjects A-D. Velocity measurements were performed at either four or three cross-sectional planes for each subject. The top row shows geometries and labeled cross-sectional planes, while the bottom four rows show respective velocity waveforms. For instance, “A-1” stands for the Section 1 in Subject A. The labels “UDV” and “MRA” refers to velocity data from UD (red) and MRA (black) measurements. Double horizontal arrows in Subject C point to the location of the side-wall aneurysm that was largely occluded due to spontaneous thrombosis.
Figure 4
Figure 4
An image showing streamlines (i.e. lines of tangent to instantaneous velocity vectors) of CFD simulated velocity vectors at peak systole in Subject D is displayed in the top left, while a three-dimensional velocity vector plot at a cutting plane of the same subject is shown in the top right. The input flow rate waveforms prescribed at the inlet (D-0) are shown in the middle left. The rest graphs in the bottom two rows illustrate CFD-simulated velocity waveforms (dashed cyan [MRA] and solid blue [UD] lines), UD-measured (solid red line), and MRA-measured (dashed black line) velocity waveforms at three different cross-sectional planes (D-1, D-2 and D-3) of this subject. The CFD-simulated velocities from which streamlines were derived were based on UD flow rates. The inclined and horizontal arrows in the 3D velocity vector plot (top right) point to velocity jets nearly the measurement sections D-2 and D-3, respectively. The double arrows in the streamline plot (top left) point to the disturbed low velocity region proximal to D-3.
Figure 5
Figure 5
Plot of (a) averaged and (b) maximum spatial velocity gradients over the pre-selected sample volumes (1 × 1 × 1 mm3) for a cardiac cycle. The CFD-simulated velocities from which spatial gradients were derived were based on UD flow rates (see Fig. 4).
Figure 5
Figure 5
Plot of (a) averaged and (b) maximum spatial velocity gradients over the pre-selected sample volumes (1 × 1 × 1 mm3) for a cardiac cycle. The CFD-simulated velocities from which spatial gradients were derived were based on UD flow rates (see Fig. 4).

References

    1. Allan PLP. Clinical Doppler ultrasound. Churchill Livingstone/Elsevier; Oxford: 2006.
    1. Bland JM, Altman DG. Statistical methods for assessing agreement between two methods of clinical measurement. Lancet. 1986;1:307–10. - PubMed
    1. Campbell JD, Hutchison KJ, Karpinski E. Variation of Doppler ultrasound spectral width in the post-stenotic velocity field. Ultrasound Med Biol. 1989;15:611–9. - PubMed
    1. Censor D, Newhouse VL, Vontz T, Ortega HV. Theory of ultrasound Doppler-spectra velocimetry for arbitrary beam and flow configurations. IEEE Trans Biomed Eng. 1988;35:740–51. - PubMed
    1. Douville Y, Johnston KW, Kassam M. Determination of the hemodynamic factors which influence the carotid Doppler spectral broadening. Ultrasound Med Biol. 1985;11:417–23. - PubMed