. 2011 Feb 8;6(2):e14662.
doi: 10.1371/journal.pone.0014662.

Analysis of common and specific mechanisms of liver function affected by nitrotoluene compounds

Affiliations

Analysis of common and specific mechanisms of liver function affected by nitrotoluene compounds

Youping Deng et al. PLoS One. .

Abstract

Background: Nitrotoluenes are widely used chemical manufacturing and munitions applications. This group of chemicals has been shown to cause a range of effects from anemia and hypercholesterolemia to testicular atrophy. We have examined the molecular and functional effects of five different, but structurally related, nitrotoluenes on using an integrative systems biology approach to gain insight into common and disparate mechanisms underlying effects caused by these chemicals.

Methodology/principal findings: Sprague-Dawley female rats were exposed via gavage to one of five concentrations of one of five nitrotoluenes [2,4,6-trinitrotoluene (TNT), 2-amino-4,6-dinitrotoluene (2ADNT) 4-amino-2,6-dinitrotoulene (4ADNT), 2,4-dinitrotoluene (2,4DNT) and 2,6-dinitrotoluene (2,6DNT)] with necropsy and tissue collection at 24 or 48 h. Gene expression profile results correlated well with clinical data and liver histopathology that lead to the concept that hematotoxicity was followed by hepatotoxicity. Overall, 2,4DNT, 2,6DNT and TNT had stronger effects than 2ADNT and 4ADNT. Common functional terms, gene expression patterns, pathways and networks were regulated across all nitrotoluenes. These pathways included NRF2-mediated oxidative stress response, aryl hydrocarbon receptor signaling, LPS/IL-1 mediated inhibition of RXR function, xenobiotic metabolism signaling and metabolism of xenobiotics by cytochrome P450. One biological process common to all compounds, lipid metabolism, was found to be impacted both at the transcriptional and lipid production level.

Conclusions/significance: A systems biology strategy was used to identify biochemical pathways affected by five nitroaromatic compounds and to integrate data that tie biochemical alterations to pathological changes. An integrative graphical network model was constructed by combining genomic, gene pathway, lipidomic, and physiological endpoint results to better understand mechanisms of liver toxicity and physiological endpoints affected by these compounds.


Conflict of interest statement

Competing Interests: Youping Deng, Xin Guan and Barbara Lynn Escalon were employed by SpecPro Inc. This does not alter the authors' adherence to all the PLoS ONE policies on sharing data and materials.

Figures

Figure 1
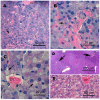
Figure 1. Pathology of livers from rats treated 48 h earlier with 50 mg/kg 2,6DNT (A,B) or 384 mg/kg TNT (C).
Photomicrographs are from 5 µm sections stained with hematoxylin and eosin. Livers from one of 5 rats treated with 50 mg/kg 2,6DNT exhibited sloughing of hepatocyte remnants into congested sinusoids (A, arrow) and microvesiculated hepatocytes (A, *). A necrotic hepatocyte with pyknotic nucleus displaced from the liver cord by infiltrating erythrocytes is shown in B (arrow). Numerous apoptotic cells (B, *) were also seen. Amorphous vacuoles occupying a considerable portion of hepatocyte cytoplasms were numerous in livers of 3 of 5 rats treated with 384 mg/kg TNT (C, arrows). One rat treated with 94 mg/kg 4ADNT had focal hemorrhagic areas in the liver (D, arrows), while livers of other rats treated with 94 and 197 mg/kg 4ADNT exhibited ballooning degeneration (E).
Figure 2
Figure 2. Representative photomicrographs of livers from rats treated 48 h earlier with vehicle (5% DMSO in corn oil, A and C) or 199 mg/kg 2,6DNT (B and D).
Photomicrographs are from 5 µm sections stained with hematoxylin and eosin. Extensive sinusoidal congestion of 2,6DNT-treated rats is shown in panel B and compared to unaffected liver of vehicle treated controls in panel A. Higher power magnification illustrates infiltration of hepatocyte cords by erythrocytes (D, arrows) and microvesiculation (D, *) seen in livers of 2,6DNT-treated rats. Unaffected liver of vehicle-treated controls at high magnification is shown in panel C.
Figure 3
Figure 3. Morphology of erythrocytes from rats treated 24 h earlier with 2,6DNT.
Photomicrographs at high magnification (100X objective with oil) of wedge preparations of blood vitally stained with new methylene blue are shown. Blood from rats treated with 199 (A) and 99 (B) mg/kg 2,6DNT are shown. Reticulocytes with blue stained mRNA are indicated by asterisks and arrows point to erythrocytes with indentations (bite cells).
Figure 4
Figure 4. The dose and time dependent numbers of transcripts regulated by 2,4DNT, 2,6DNT, 2ADNT, 4ADNT or TNT.
Rats were exposed to one of the 5 compounds for 24 h (blue line) or 48 h (red line), with one of 4 doses plus vehicle controls. Rats were sacrificed and liver tissues were employed for total RNA isolation and microarray hybridization and analysis as described in Materials and Methods. The numbers of transcripts at Y axis were achieved by comparing the gene expression profiles of animals treated with one of four doses with respective control animals at the time point 24 h or 48 h for one of the compounds.
Figure 5
Figure 5. Total transcript numbers regulated by the five compounds.
Rats were treated with different compounds with variant doses and microarray experiments were performed as described in Materials and Methods. The number of transcripts that were at each time point was analyzed using One-Way ANOVA with a Benjamin-Hochberg false discovery rate less than 0.05 across various doses at each time point (24 h or 48 h) for each compound. The total regulated transcript number for each compound was calculated by summarizing the numbers of both time points (24 h+48 h), and overlapped transcripts were only counted once. The relative up or down-regulated transcripts were obtained by comparing averaged animal samples with various dose treatments with respective control animal samples at each time point or both time points.
Figure 6
Figure 6. Hierarchical clustering of experimental conditions.
Experimental conditions were based on averaging samples with the same dose treatments of a compound for 24 h or 48 h and total 40 experimental conditions were used for the clustering. Transcripts used for making these conditional trees were selected based on filtering on flags. Only a transcript that was presented in at least 50% samples was chosen for clustering. Pearson correlation algorithm with average linkage was conducted to calculate distances between conditions.
Figure 7
Figure 7. Hierarchical clustering of significantly regulated genes.
Most significantly regulated transcripts of each compound were used for constructing gene clustering trees across different conditions including control and 4 different doses at 24 h or 48 h for each compound. Pearson correlation algorithm with average linkage was performed to calculate distances between transcripts. Two distinctive gene expression patterns: early up-regulated (early up) and early down-regulated (early down) gene expression patterns were indicated on the right of each cluster.
Figure 8
Figure 8. Most significantly canonical pathways regulated by the 5 compounds.
Top ten pathways were selected to present for each compound. Most significantly regulated transcripts of each compound were chosen to run the Ingenuity pathway tool. The bigger the -log(p-value) of a pathway is, the more significantly the pathway is regulated. The threshold lines represent a p value with 0.05.
Figure 9
Figure 9. Common and specific gene networks related to liver toxicity induced by the compounds.
The common gene network (A) was constructed using commonly significantly regulated genes by at least four of the compounds. For constructing specific gene networks related to liver toxicity of 2,4DNT(B), 2,6DNT(C), 2ADNT(D), 4ADNT(E) and TNT(F), only significantly regulated genes involved in known function to liver or hepatoxicity or liver diseases were selected for each compound. The red and green highlighted genes represent up-regulated and down-regulated genes respectively by one of the compound. The orange highlighted genes are involved in NRF2-mediated oxidative stress response. The up or down-regulated genes in the networks were determined by comparing the averaged treatments with relative controls of a compound. The gene networks were built using the Ingenuity knowledge base tool. The networks scores described in Materials and Methods for all the networks were bigger than 10.
Figure 10
Figure 10. Hierarchical clustering of commonly significantly regulated lipid species in response to 2,4DNT, 2,6DNT, 2ADNT, 4ADNT and TNT.
Rats were treated with 2,4DNT, 2,6DNT 2ADNT, 4ADNT or TNT with one of 3 doses including controls for each compound for 24 h. Rats were sacrificed and liver tissues were used for lipid extraction and lipid profile measurement as described in Materials and Methods. Actually the same samples were also used for the microarray studies. 36 individual lipid species (A) and 9 total lipid classes (B) that were significantly commonly regulated by at least 3 of the compounds. Significantly regulated individual lipid species or lipid classes were determined using One-Way ANOVA with a multiple adjust p value less than 0.05 across various doses of a compound.
Figure 11
Figure 11. An integrated network model to explain the molecular mechanisms of hepatoxicity induced by the compounds.
Environmental chemicals, gene functional terms, pathway cross talks, gene networks, and physiological endpoints were integrated to form a network at the system level to account for the molecular mechanisms of hepatoxicity mediated by these compounds. Red and green highlighted functional terms, genes, and pathways were generally up-regulated and down-regulated respectively by these compounds.

References

    1. Jenkins TF, Hewitt AD, Grant CL, Thiboutot S, Ampleman G, et al. Identity and distribution of residues of energetic compounds at army live-fire training ranges. Chemosphere. 2006;63:1280–1290. - PubMed
    1. Wintz H, Yoo LJ, Loguinov A, Wu YY, Steevens JA, et al. Gene expression profiles in fathead minnow exposed to 2,4-DNT: correlation with toxicity in mammals. Toxicol Sci. 2006;94:71–82. - PubMed
    1. Gust KA, Pirooznia M, Quinn MJ, Jr, Johnson MS, Escalon L, et al. Neurotoxicogenomic investigations to assess mechanisms of action of the munitions constituents RDX and 2,6-DNT in Northern bobwhite (Colinus virginianus). Toxicol Sci. 2009;110:168–180. - PubMed
    1. Levine BS, Furedi EM, Gordon DE, Barkley JJ, Lish PM. Toxic interactions of the munitions compounds TNT and RDX in F344 rats. Fundam Appl Toxicol. 1990;15:373–380. - PubMed
    1. Talmage SS, Opresko DM, Maxwell CJ, Welsh CJ, Cretella FM, et al. Nitroaromatic munition compounds: environmental effects and screening values. Rev Environ Contam Toxicol. 1999;161:1–156. - PubMed

Publication types