. 2011 Feb 8;6(2):e16758.
doi: 10.1371/journal.pone.0016758.

Timescales of multineuronal activity patterns reflect temporal structure of visual stimuli

Affiliations

Timescales of multineuronal activity patterns reflect temporal structure of visual stimuli

Ovidiu F Jurjuţ et al. PLoS One. .

Abstract

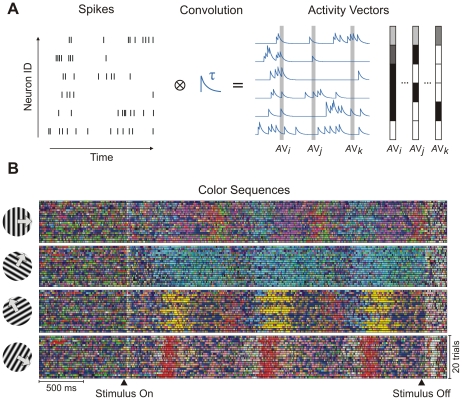
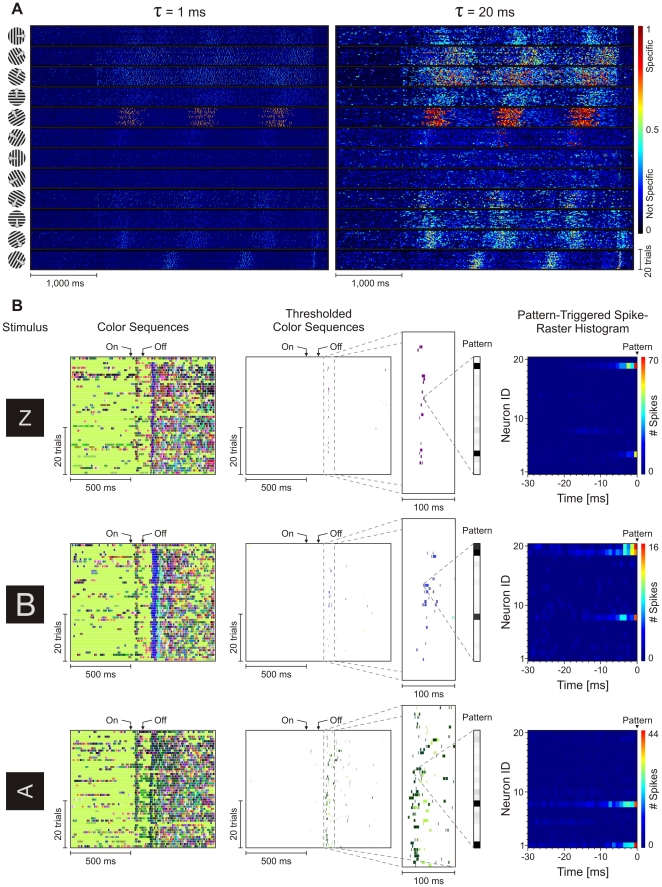
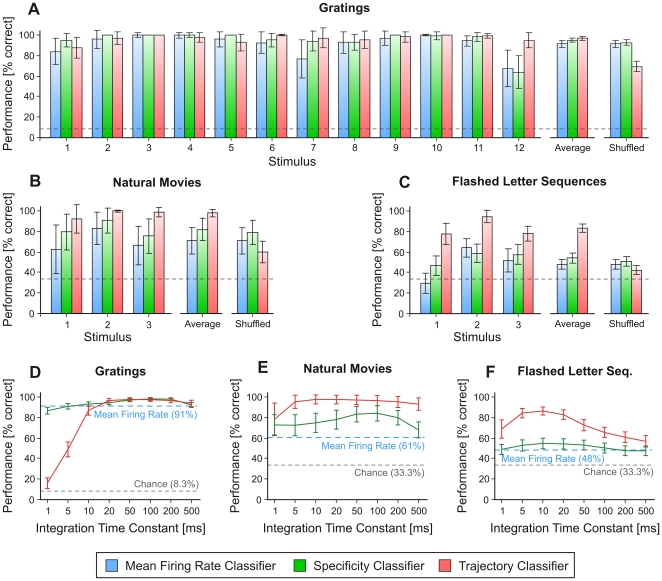
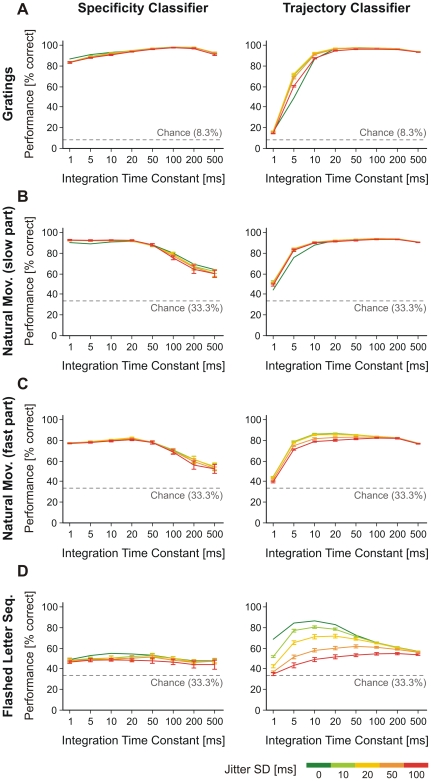
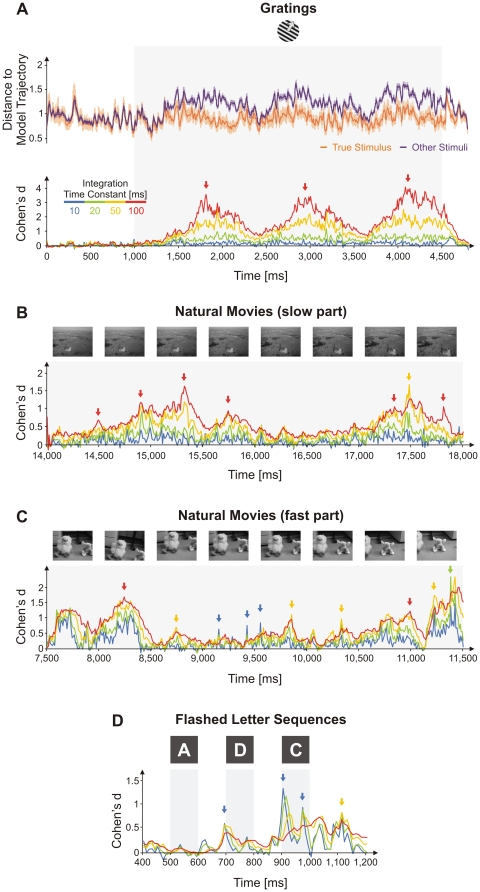
The investigation of distributed coding across multiple neurons in the cortex remains to this date a challenge. Our current understanding of collective encoding of information and the relevant timescales is still limited. Most results are restricted to disparate timescales, focused on either very fast, e.g., spike-synchrony, or slow timescales, e.g., firing rate. Here, we investigated systematically multineuronal activity patterns evolving on different timescales, spanning the whole range from spike-synchrony to mean firing rate. Using multi-electrode recordings from cat visual cortex, we show that cortical responses can be described as trajectories in a high-dimensional pattern space. Patterns evolve on a continuum of coexisting timescales that strongly relate to the temporal properties of stimuli. Timescales consistent with the time constants of neuronal membranes and fast synaptic transmission (5-20 ms) play a particularly salient role in encoding a large amount of stimulus-related information. Thus, to faithfully encode the properties of visual stimuli the brain engages multiple neurons into activity patterns evolving on multiple timescales.


Conflict of interest statement

Competing Interests: The authors have declared that no competing interests exist.

Figures

Figure 1
Figure 1. From spikes to multineuronal patterns.
(A) Low-pass filtering of simultaneously recorded spike trains by convolution with a decaying exponential function. Activity vectors are obtained by sampling the resulting continuous traces at each time step. (B) Color representation of stereotypical patterns corresponding to activity vectors from a dataset recorded with drifting sinusoidal gratings. Color sequences corresponding to trials evoked by 4 grating stimuli are shown, grouped by the stimulus (τ = 20 ms).
Figure 2
Figure 2. Pattern specificity.
(A) Specificity plots at two integration time constants for responses to drifting sinusoidal gratings. Far right: color intensity code for specificity. (B) Appearance of specific and stimulus-locked patterns with a time constant of 5 ms. Three examples (rows) are shown from the dataset with 49 flashed graphemes. From left to right: stimulus, color sequences on 50 trials, specificity thresholded color sequences (see text) with inset showing patterns precisely stimulus-locked across trials, pattern-triggered spike raster histograms (see text). Activation of component neurons in the patterns is shown in the second level inset (“Pattern”) with grayscale coding (white, activation  = 0; black, activation ≥1).
Figure 3
Figure 3. Information content of patterns and dependence of classification on the temporal scale.
(A)–(C) Classification performance of three classifiers with τ = 20 ms (blue: mean rate; green: pattern specificity; red: pattern trajectory) for datasets evoked with drifting sinusoidal gratings (A), natural movies (B), and flashed letter sequences (C). Shown are: performance for each stimulus condition, average performance, and average performance after shuffling the spike-trains (see text). (D)–(F) Performance is shown as a function of the integration time constant (τ) for datasets with drifting sinusoidal gratings (D), natural movies (E), and flashed letter sequences (F). Error bars represent s.d. Dashed lines mark chance levels.
Figure 4
Figure 4. Effect of spike jitter on classification performance.
Specificity classifiers (left) and trajectory classifiers (right) for: grating stimuli (A), slow (B) and fast (C) segments of natural movies, and flashed letter sequences (D). The applied jitters are 10 ms (light green), 20 ms (yellow), 50 ms (orange), and 100 ms (red). Original classification performance, without jittering, is shown in dark green curves. Error bars represent s.d. over independent jitters.
Figure 5
Figure 5. Time of occurrence and timescale of informative patterns.
(A) Trajectory analysis on drifting grating stimuli. Top inset: Average distance from trajectories on test trials of a given stimulus to the model trajectory of the true stimulus (orange) and the model trajectories of other stimuli (magenta). τ = 20 ms. Cohen's d between the two distance traces for different integration time constants, τ, for grating stimuli (bottom inset in (A)), slow (B) and fast (C) segments of natural movies, and a flashed letter sequence (D). Light gray bands indicate stimulus presentation periods. Error bars on distance traces in (A) are s.e.m.

Similar articles

Cited by

References

    1. Perkel D, Bullock TH. Neural coding. Neurosci Res Prog Bulletin. 1968;6:221–348.
    1. Eggermont JJ. Is there a neural code? Neurosci Biobehav Rev. 1998;22:355–370. - PubMed
    1. Adrian ED. New York: W.W. Norton & Co; 1928. The basis of sensation: the action of the sense organs.
    1. Hubel DH, Wiesel TN. Receptive fields, binocular interaction and functional architecture in the cat's visual cortex. J Physiol. 1962;160:106–154. - PMC - PubMed
    1. Singer W. Neuronal synchrony: a versatile code for the definition of relations? Neuron. 1999;24:49–65, 111-25. - PubMed

Publication types