. 2011 Feb 8;6(2):e16795.
doi: 10.1371/journal.pone.0016795.

Role of HDAC3 on p53 expression and apoptosis in T cells of patients with multiple sclerosis

Affiliations

Role of HDAC3 on p53 expression and apoptosis in T cells of patients with multiple sclerosis

Fanglin Zhang et al. PLoS One. .

Abstract

Background: Histone deacetylase 3 (HDAC3) belongs to a family of proteins which plays an important role in protein acetylation, chromatin remodeling and transcription of genes, including those that are involved in cell proliferation and cell death. While increased expression of HDAC3 is seen in neoplastic cells, the role of HDAC3 in T cells and their role in autoimmune disease is not known.

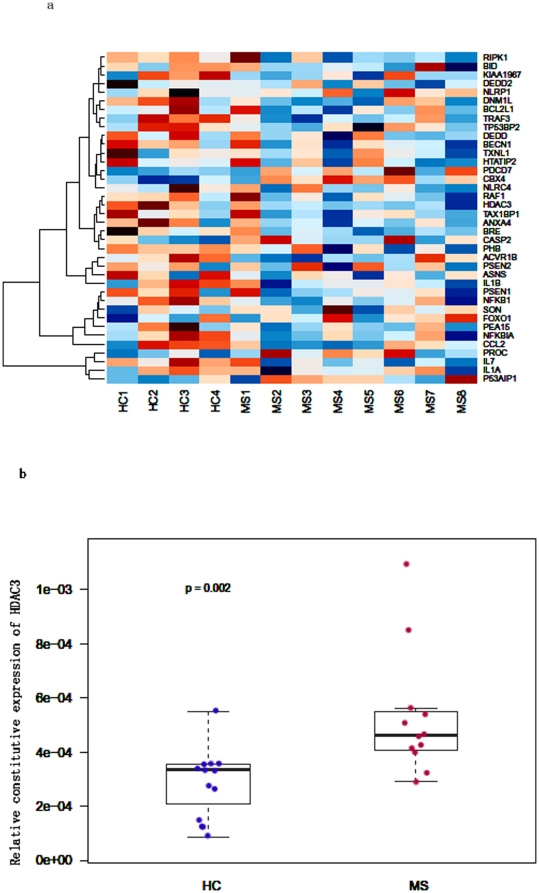
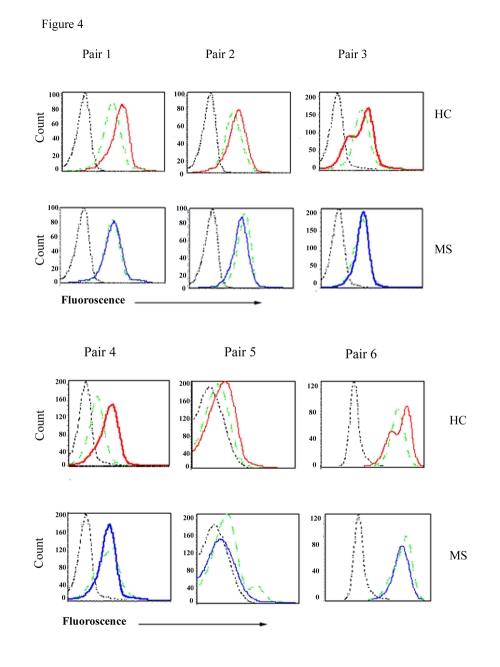
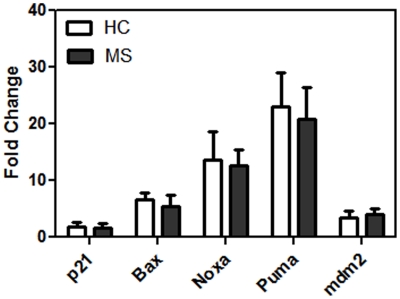
Methodology/principal findings: Applying Affymetrix GeneChip Human Gene 1.0 ST Array and the mixed effects model for gene set analysis, we compared gene expression profiles between multiple sclerosis (MS) patients and healthy controls (HC). Within the Apoptosis_GO gene set, the constitutive expression level of HDAC3 in peripheral blood mononuclear cell (PBMC) was significantly increased in MS patients when compared to controls. Following addition of trichostatin A (TSA), an inhibitor of HDAC3, we examined the expression of p53 by flow cytometry and p53 targeted genes by real time RT-PCR in MS and HC. Culture of PBMC with TSA resulted in increased expression of p53 in HC but not in MS patients. TSA treated T cells from MS patients also showed reduced sensitivity to apoptosis when compared to HC, which was independent of activation of p53 targeted pro-apoptotic genes.

Conclusion/significance: MS patients, when compared to controls, show an increased expression of HDAC3 and relative resistance to TSA induced apoptosis in T cells. Increased expression of HDAC3 in PBMC of MS patients may render putative autoreactive lymphocytes resistance to apoptosis and thereby contribute to autoimmunity.


Conflict of interest statement

Competing Interests: The authors have declared that no competing interests exist.

Figures

Figure 1
Figure 1. Constitutive expression levels of HDAC3 in HC and MS patients.
1a. Heat map shows constitutive expression level of genes involved in Apoptosis_GO gene set in MS patients and HC. The rows correspond to normalized, log (base 2) transformed gene expressions from PBMC of 4 HC and 8 MS patients. Red color indicates high expression and blue color indicates low expression. 1b. Real Time RT-PCR verified that the constitutive expression of HDAC3 in PBMC were significantly different (p = 0.002) in HC and MS patients. In these box plots, the bottom, middle and top of the box represent 25th, 50th and 75th percentile of gene expression levels normalized to beta actin in PBMC from 12 HC and 12 MS patients.
Figure 2
Figure 2. p53 expression in PBMC following culture with TSA in HC examined by flow cytometry.
2a. The expression of p53 following culture with TSA for 48 hrs at doses of 0.25 µM (top panel, blue line), 0.5 µM (middle panel, green line), 1.0 µM (bottom panel, red line). In all these three panels, the dotted line represents isotype antibody control, and the purple line represents the expression of p53 in lymphocytes cultured with DMSO in the absence of TSA. 2b. Increased expression of p53 following culture with 0.5 µM TSA at 6 h (top panel, blue line), 24 h (middle panel, green line) and 48 h (bottom panel, red line) respectively. In all these three panels, the dotted line represents isotype antibody control, and the black line represents expression of p53 in cells cultured with DMSO only. 2c. Expression of p53 in T cell subsets cultured with 0.5 µM of TSA for 48 h. Panels from top to bottom are: PBMC, CD3+, CD4+/CD3+ and CD8+/CD3+ subset of T lymphocytes. In all these four panels, the dotted line represents isotype antibody control; the red line represents the expression of p53 in cells cultured with DMSO in the absence of TSA and the blue line represents the expression of p53 in lymphocytes cultured with 0.5 µM of TSA for 48 h. The x axis represents increasing fluorescence intensity of p53, y axis represents cell number. Data are representative of 6 independent experiments.
Figure 3
Figure 3. Detection of apoptosis by TSA in HC using flow cytometry.
3a. Top panel shows the increase in apoptosis in the presence of TSA at concentration of 0 µM, 1 µM, 0.25 µM, 0.5 µM and 1 µM after 48 h culture. Bottom panel shows the kinetic of apoptosis in PBMC treated with TSA at concentration of 0.5 µM for 6 h, 24 h and 48 h. 3b. Top panel shows apoptosis in DMSO treated cells as control. Bottom panel shows apoptosis in 0.5 µM TSA treated cells for 48 h. Both panels, from left to right, represent PBMC, CD3+, CD4+/CD3+ and CD8+/CD3+ lymphocytes respectively. Data are the representative of 15 independent experiments.
Figure 4
Figure 4. Detection of p53 expression in PBMC treated with TSA in HC and MS patients using flow cytometry.
Increased expression of p53 in PBMC from HC but not in MS patients, treated with 0.5 µM TSA for 48 h. Dotted black line represents isotype antibody control; dotted green line, represents p53 expression in the absence of TSA; red line, p53 expression in the presence of TSA. Results are shown as paired samples of MS patients and HC; each pair was analyzed using flow cytometry on the same day.
Figure 5
Figure 5. Susceptibility of PBMC to TSA induced apoptosis in HC and MS patients.
Reduced susceptibility to TSA induced apoptosis in 18 MS patients when compared to 15 HC. PBMC were treated with 0.5 µM TSA for 48 h. Cells treated with DMSO in the absence of TSA served as a negative control.
Figure 6
Figure 6. Real time RT-PCR studies on a panel of p53 regulated genes in PBMC treated with TSA between HC and MS.
PBMC were treated with 0.5 µM TSA for 24 h, with DMSO in the absence of TSA as control. Results are expressed as fold change in expression of mRNA levels for each gene normalized to beta actin and compared to control.

Similar articles

Cited by

References

    1. Compston A, Coles A. Multiple sclerosis. Lancet. 2008;372:1502–1517. - PubMed
    1. Frohman EM, Racke MK, Raine CS. Multiple sclerosis—the plaque and its pathogenesis. N Engl J Med. 2006;354:942–955. - PubMed
    1. Noseworthy JH, Lucchinetti C, Rodriguez M, Weinshenker BG. Multiple Sclerosis. NewEngJ Med. 2000;343:938–946. - PubMed
    1. Zivadinov R, Weinstock-Guttman B, Zorzon M, Uxa L, Serafin M, et al. Gene-environment interactions between HLA B7/A2, EBV antibodies are associated with MRI injury in multiple sclerosis. J Neuroimmunol. 2009;209:123–130. - PubMed
    1. McFarland HF, Martin R. Multiple sclerosis: a complicated picture of autoimmunity. Nat Immunol. 2007;8:913–919. - PubMed

Publication types

MeSH terms