. 2008 Mar 1:2008:11-5.

Reverse translational bioinformatics: a bioinformatics assay of age, gender and clinical biomarkers

Affiliations

Reverse translational bioinformatics: a bioinformatics assay of age, gender and clinical biomarkers

Amit Fliss et al. Summit Transl Bioinform. .

Abstract

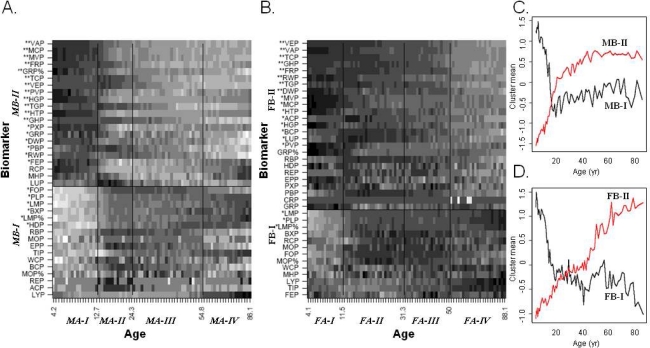
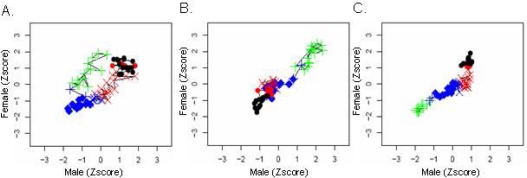
In bioinformatics, clinical data is rarely used. Here, we propose using bedsidedata in basic research, via bioinformatics methodologies. To demonstrate the potential of this so called Reverse Translational Bioinformatics approach, classical bioinformatics tools were applied to blood biomarker information attained from a large scale, open-access cross sectional survey. The results of this analysis include a novel classification of blood biomarkers, critical ages in which basic biological processes may shift in humans, and a possible approach to exploring the gender specificity of these shifts. Changes in normal values were also shown to be non-linear, with most of the non-linearity attributed to the shift from growth to maturity. Together, these finding demonstrate that reversed translational bioinformatics may contribute to basic research.


Figures

Figure 1.
Figure 1.
K-means clustering of age groups and blood biomarkers. Males (A) and females (B) from the NHANES3 survey were divided into equal size groups (N=150). A derived matrix of row-normalized median values for each biomarker in each age group was independently clustered with the K-means algorithm for each age group, assuming 4 such clusters, and biomarkers, assuming 2 such clusters. Cluster borders are indicated by lines and denominated by italics labels on the appropriate axis. The cluster means for men (C) and women (D) in each age group is also shown for the biomarker clusters (red and black lines correspondingly). Biomarkers are sorted within each cluster (from top to bottom) in decreasing covariance with the cluster mean, with 1 or 2 stars indicating biomarkers with r2≥0.2 or r2≥0.4, correspondingly. Abbreviations: ACP, serum alpha carotene; BCP, serum beta carotene; BXP, serum beta cryptoxanthin; CRP, serum C-reactive protein; DWP, platelet distribution width (%); EPP, erythrocyte protoporphyrin; FEP, serum iron; FOP, Serum folate; FRP, serum ferritin; GHP, glycated hemoglobin (%); GRP, granulocyte number (Coulter); GRP%, segment neutrophil (% of 100 cells); HDP, serum HDL cholesterol; HGP, hemoglobin; HTP, hematocrit (%); LMP, lymphocyte number (Coulter); LMP%, lymphocytes (% of 100 cells); LYP, serum lycopene; LUP, serum lutein/zeaxanthin; MCP, mean cell hemoglobin; MHP, mean cell hemoglobin concentration; MOP, mononuclear number (Coulter); MOP%, monocytes (% of 100 cells); MVP, mean cell volume; PBP, serum lead; PLP, platelet count; PVP, mean platelet volume; PXP, serum transferrin saturation; RBP, RBC folate; RCP, red blood cell count; REP, serum sum retinyl esters; RWP, red cell distribution width; TCP, serum cholesterol; TGP, serum triglycerides; TIP, serum TIBC; VAP, serum vitamin A; VEP, serum vitamin E; WCP, white blood cell count.
Figure 2.
Figure 2.
Gender differences in biomarker changes during growth and aging. The age-specific median of serum lead levels (A), platelet counts (B), and serum vitamin A levels (C) is plotted for males (X axis) and females (Y axis). Each value was z-transformed (i.e. subtracting the mean and dividing the difference by the standard deviation of the each biomarker). Each point represents a comparison of similar age bins in the two genders, and is connected with a line to the previous and next age group. The shape of each point represents the cluster it belongs to in males (MA-I, plus; MA-II, diamond; MAfli-III, X; MA-IV, dot), and its color represents females clusters (FA-I, green; FA-II, blue; FA-III, red; FA-IV, black).

References

    1. Wessler S, Gitel SN, Salzman E, Deykin D, Licht J, Freedberg AS, et al. Warfarin - From Bedside To Bench. New England Journal of Medicine. [Discussion] 1984;311(10):645–52. - PubMed
    1. Quackenbush J.Microarray data normalization and transformation Nat Genet 2002. 2002 December32Suppl496–501. - PubMed
    1. Listgarten J, Emili A.Statistical and computational methods for comparative proteomic profiling using liquid chromatography-tandem mass spectrometry Mol Cell Proteomics 2005. 2005April44419–34. - PubMed
    1. Bogue M, Grubb S.The Mouse Phenome Project Genetica 2004. 2004 September122171–4. - PubMed
    1. Swanson DR.Fish oil, Raynaud’s syndrome, and undiscovered public knowledge Perspect Biol Med 1986. 1986 3017–18. - PubMed

LinkOut - more resources