. 2011 Feb 15;6(2):e17121.
doi: 10.1371/journal.pone.0017121.

Characterization of the contradictory chromatin signatures at the 3' exons of zinc finger genes

Affiliations

Characterization of the contradictory chromatin signatures at the 3' exons of zinc finger genes

Kimberly R Blahnik et al. PLoS One. .

Abstract

The H3K9me3 histone modification is often found at promoter regions, where it functions to repress transcription. However, we have previously shown that 3' exons of zinc finger genes (ZNFs) are marked by high levels of H3K9me3. We have now further investigated this unusual location for H3K9me3 in ZNF genes. Neither bioinformatic nor experimental approaches support the hypothesis that the 3' exons of ZNFs are promoters. We further characterized the histone modifications at the 3' ZNF exons and found that these regions also contain H3K36me3, a mark of transcriptional elongation. A genome-wide analysis of ChIP-seq data revealed that ZNFs constitute the majority of genes that have high levels of both H3K9me3 and H3K36me3. These results suggested the possibility that the ZNF genes may be imprinted, with one allele transcribed and one allele repressed. To test the hypothesis that the contradictory modifications are due to imprinting, we used a SNP analysis of RNA-seq data to demonstrate that both alleles of certain ZNF genes having H3K9me3 and H3K36me3 are transcribed. We next analyzed isolated ZNF 3' exons using stably integrated episomes. We found that although the H3K36me3 mark was lost when the 3' ZNF exon was removed from its natural genomic location, the isolated ZNF 3' exons retained the H3K9me3 mark. Thus, the H3K9me3 mark at ZNF 3' exons does not impede transcription and it is regulated independently of the H3K36me3 mark. Finally, we demonstrate a strong relationship between the number of tandemly repeated domains in the 3' exons and the H3K9me3 mark. We suggest that the H3K9me3 at ZNF 3' exons may function to protect the genome from inappropriate recombination rather than to regulate transcription.


Conflict of interest statement

Competing Interests: The authors have declared that no competing interests exist.

Figures

Figure 1
Figure 1. ZNF 3′ ends are not enriched for promoter motifs or CAGE tags.
(A) The 3′ ends of the ZNFs bound by H3K9me3, as well as a 1kb region centered on the start site (promoter) and a 1 kb region located 10 kb upstream (enhancer) of the same genes were searched in forward and reverse orientations for the sequence of nine motifs previously found to be enriched in promoter regions . Since the sizes of the H3K9me3 regions varied from site to site, the data was normalized such that the motif counts are reported as the number of motifs found per 1000 base pairs. (B) The number of CAGE tags corresponding to the regions of the 3′ ends of the ZNFs bound by H3K9me3, as well as a 1 kb region centered on the start site (promoter) and a 1 kb region located 10 kb upstream (enhancer) of the same genes was determined; the data was normalized as described in Figure 1A.
Figure 2
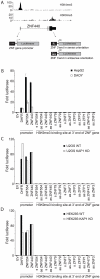
Figure 2. The 3′ ends of ZNF genes do not display promoter activity.
A) ChIP-seq signal tracks from Ntera2 cells are shown for the ZNF440 gene. H3K4me3 binding is observed at the promoter (top panel), while H3K9me3 localizes to the 3′ end of the ZNF440 gene (bottom panel). The number of sequenced tags is plotted on the y-axis. Shown below the ZNF440 gene schematic are representative constructs for the experiments shown in panels B–D. Promoter regions (from ∼500 bp upstream to ∼100 bp downstream of TSS) and 3′ regions bound by H3K9me3 in vivo were cloned in front of the luciferase cDNA; the 3′ regions were cloned in either the sense (s) or antisense (as) direction (see Table S2 for coordinates of the genomic fragments used for promoter analyses). B–D) Luciferase assays were performed to test for promoter activity at 3′ ends of ZNF genes. The DHFR, ZNF440 and ZNF554 promoters were used as positive controls and an empty vector (EV) was used as a background control. Promoter activity was tested in Ntera2 and DAOY cells B), in U2OS cells (C) and in HEK293 cells (D). In addition, the U2OS and HEK23 cells were also stably transfected with a KAP1 shRNA construct (indicated as KAP1 KD). Fold luciferase was determined based on the empty vector control and is plotted on the y-axis.
Figure 3
Figure 3. ZNF3′ ends are marked by H3K36me3.
Shown for a region of chromosome 19 (hg18 coordinates) are the RNAseq, H3K36me3, and H3K9me3 patterns for hES cells. Also shown is a track that indicates the position of the ZNF genes within that region. The hES RNAseq and ChIP-seq experiments were performed as part of the NIH Roadmap Epigenome Mapping Consortium (http://www.roadmapepigenomics.org/). The RNAseq data and the H3K4me3 and H3K9me3 modifications of a small set of loci have been previously analyzed as part of a previous publication .
Figure 4
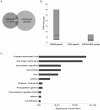
Figure 4. ZNFs are the largest category of genes that have both H3K9me3 and H3K36me3 marks.
(A) Shown is a Venn diagram indicating the number of regions bound by H3K9me3, H3K36me3, and both marks, as determined by analysis of hES cell ChIP-seq data using Sole-searchv2. (B) The number of RNA-seq tags corresponding to regions identified as bound by H3K9me3 alone, H3K36me3 alone, and by both H3K9me3 and H3K36me3 is plotted. (C) The regions bound by both H3K36me3 and H3K9me3 were analyzed using the DAVID gene ontology program . The gene nearest to each binding site was chosen for analysis; shown are the enriched terms and P-value of enrichments.
Figure 5
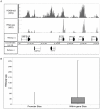
Figure 5. ZNF 3′ exons are transcribed.
(A) Shown for a region of chromosome 19 is the ChIP-seq pattern for H3K9me3 and the RNA pattern obtained using RNAseq, both from hES cells. (B) Shown on the Y axis are the number of RNA-seq tags from hES cells corresponding to H3K9me3 bound regions that are classified as promoters (183 sites) or intragenic (433 sites).
Figure 6
Figure 6. H3K9me3 and H3K36me3 are not co-regulated at ZNF 3′ ends.
(A) ChIP experiments were performed in HEK293 cells using antibodies specific for H3me3K9 and H3me3K36; IgG was used as a negative control. Using primers specific for the endogenous chromosomal regions, the 3′ exons of 4 ZNFs shown by ChIP-seq of hES cells to be bound by both H3K36me3 and K3K9me3 (ZNF555, ZNF77, ZNF333, and ZNF426) were show to be bound by both marks in the HEK293 cells. In contrast, ZNF556, which bound only by H3K9me3 (as was predicted from the ChIP-seq binding patterns from hES cells. The GAPDH gene was used as a positive control for H3K36me3 and a negative control for H3K9me3 and the GMNN promoter served as a negative control for both marks. (B) eChIP experiments were performed (using primers specific for the regions cloned into the episomal vectors) in HEK293 cells harboring episomal constructs containing the indicated regions. Antibodies specific for H3me3K9 and H3me3K36 were used and IgG was used as a negative control. Episomal constructs harboring the 3′ ends of ZNF555, ZNF556, and ZNF77 were analyzed; an empty episomal vector and an episomal vector harboring the GMNN promoter were used as negative controls. The hygromycin cDNA (located on the opposite side of the episome from the cloning site) was used as a positive control for H3K36me3.
Figure 7
Figure 7. H3K9me3 enrichment at ZNF 3′ ends correlates with the number of finger domains.
Shown is the percentage of ZNF genes having the specified numbers of zinc fingers that are targeted by H3K9me3 or H3K36me3 (ZNF genes having from 1 to 25 zinc fingers were used for this analysis).
Figure 8
Figure 8. ZNF 3′ exons are covered by H3K9me3 and H3K36me3 in both pluripotent and differentiated cell types.
Shown are the ChIP-seq profiles of H3K9me3 and H3K36me3 for a section of chromosome 19 from Ntera2 (pluripotent testicular embryonal carcinoma from a 22 year old male), Proliferating Blood Mononuclear Cells (PBMC) from a 28 year old male), K562 (chronic myelogenous leukemia from a 53-year-old female), and U2OS (moderately differentiated sarcoma of the tibia of a 15 year old girl) cells. The number of sequenced tags is plotted on the y-axis, the positions of 3 ZNF genes are indicated on the x axis (the direction of transcription is indicated by the arrows), and the antibody used for each experiment is indicated on the right side of the figure.

References

    1. Crews D. Epigenetics, brain, behavior, and the environment. Hormones (Athens) 2010;9:41–50. - PubMed
    1. Grayson DR, Chen Y, Dong E, Kundakovic M, Guidotti A. From trans-methylation to cytosine methylation: evolution of the methylation hypothesis of schizophrenia. Epigenetics. 2009;4:144–149. - PubMed
    1. Iwamoto K, Kato T. Epigenetic profiling in schizophrenia and major mental disorders. Neuropsychobiology. 2009;60:5–11. - PubMed
    1. Jiang Y, Langley B, Lubin FD, Renthal W, Wood MA, et al. Epigenetics in the nervous system. J Neurosci. 2008;28:11753–11759. - PMC - PubMed
    1. McCarthy MM, Auger AP, Bale TL, De Vries GJ, Dunn GA, et al. The epigenetics of sex differences in the brain. J Neurosci. 2009;29:12815–12823. - PMC - PubMed

Publication types