. 2011 Feb 15;6(2):e16819.
doi: 10.1371/journal.pone.0016819.

Improved innate and adaptive immunostimulation by genetically modified HIV-1 protein expressing NYVAC vectors

Affiliations

Improved innate and adaptive immunostimulation by genetically modified HIV-1 protein expressing NYVAC vectors

Esther D Quakkelaar et al. PLoS One. .

Abstract

Attenuated poxviruses are safe and capable of expressing foreign antigens. Poxviruses are applied in veterinary vaccination and explored as candidate vaccines for humans. However, poxviruses express multiple genes encoding proteins that interfere with components of the innate and adaptive immune response. This manuscript describes two strategies aimed to improve the immunogenicity of the highly attenuated, host-range restricted poxvirus NYVAC: deletion of the viral gene encoding type-I interferon-binding protein and development of attenuated replication-competent NYVAC. We evaluated these newly generated NYVAC mutants, encoding HIV-1 env, gag, pol and nef, for their ability to stimulate HIV-specific CD8 T-cell responses in vitro from blood mononuclear cells of HIV-infected subjects. The new vectors were evaluated and compared to the parental NYVAC vector in dendritic cells (DCs), RNA expression arrays, HIV gag expression and cross-presentation assays in vitro. Deletion of type-I interferon-binding protein enhanced expression of interferon and interferon-induced genes in DCs, and increased maturation of infected DCs. Restoration of replication competence induced activation of pathways involving antigen processing and presentation. Also, replication-competent NYVAC showed increased Gag expression in infected cells, permitting enhanced cross-presentation to HIV-specific CD8 T cells and proliferation of HIV-specific memory CD8 T-cells in vitro. The recombinant NYVAC combining both modifications induced interferon-induced genes and genes involved in antigen processing and presentation, as well as increased Gag expression. This combined replication-competent NYVAC is a promising candidate for the next generation of HIV vaccines.


Conflict of interest statement

Competing Interests: JT is employed by Sanofi Pasteur, which is a partner in the Poxvirus T Cell Vaccine Discovery Consortium, primarily in its capacity as the industrial partner in downstream clinical development. CJMM has been employed part-time (75%) since January 20, 2008, by ISA Pharmaceuticals and has been granted options on ISA Pharmaceuticals stock. This does not alter the authors' adherence to all the PLoS ONE policies on sharing data and materials.

Figures

Figure 1
Figure 1. IFN-α production after infection of DCs with recombinant NYVAC.
cDCs (white bars), and moDCs (black bars) were infected for one hour with the two different recombinant viruses NYVAC-C and NYVAC-C-ΔB19R (MOI 1). Forty-eight hours post infection, IFN-α production was analyzed by ELISA. Mean values of two independent experiments are shown. Deletion of type-I IFN binding protein resulted in enhanced IFN-α production after infection of cDCs.
Figure 2
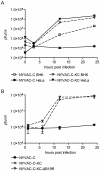
Figure 2. Replication of NYVAC-C and NYVAC-C-KC in human HeLa cells.
A) Human HeLa cells (solid line, closed symbols) or BHK cells (dashed line, open symbols) were infected with NYVAC-C (triangles) or NYVAC-C-KC (squares). B) HeLa cells were infected with NYVAC-C (black squares) or the replication-competent NYVAC-C-KC (open diamond) and NYVAC-C-KC-ΔB19R (open triangle). A MOI of 5 was used for all infections. Cultures were harvested immediately after infection, or at the indicated time points post infection. Virus was released from cells by multiple rounds of freezing and thawing, and released virus was titrated on permissive BHK cells. Introduction of K1L and C7L into NYVAC-C fully restored replication competence in human HeLa cells, comparable to replication in BHK cells. Additional deletion of the B19R gene did not alter replication capacity. Data representative of at least 3 independent experiments are shown.
Figure 3
Figure 3. Venn diagram of the number of common and unique genes in cDCs and pDCs after infection with NYVAC-C and its mutants.
Venn-diagrams showing the numbers of genes that are up- and down-regulated in cDCs (left panel) and pDCs (right panel) after infection with NYVAC-C-ΔB19R, NYVAC-C-KC or NYVAC-C-KC-ΔB19R. In cDCs 157, 750 and 828 genes are uniquely differentially expressed (p<0.05) in NYVAC-C-ΔB19R, NYVAC-C-KC and NYVAC-C-KC-ΔB19R, respectively. In pDCs 1742, 228 and 617 genes are uniquely differentially expressed (p<0.05) in NYVAC-C-ΔB19R, NYVAC-C-KC and NYVAC-C-KC-ΔB19R, respectively. For each gene, the expression induced by NYVAC-C-ΔB19R, NYVAC-C-KC or NYVAC-C-KC-ΔB19R was tested for differential expression by comparison to the expression induced by NYVAC-C (n ranges between 2 and 18).
Figure 4
Figure 4. Gene set enrichment analysis of NYVAC-C and NYVAC-C-KC-ΔB19R infected cDCs and pDCs.
GSEA of the list of genes ranked according to the expression difference between NYVAC-C and NYVAC-C-KC-ΔB19R in cDCs (A-B) and pDCs (C). GSEA using C2 database (A, C) and C5 database (B) is shown. Figure shows the pattern of enrichment using selected significant pathways and their top 5 genes members selected from the leading edge subset (genes that contribute most to the enrichment score). The left gray and blue section of the figure shows the pathway membership for each gene (blue, present in the pathway; grey, absent). The heatmap shows the expression level of each gene scaled to have mean zero and standard deviation one (red, up-regulated; green, down-regulated). Each column in the heatmap represents a replicate (n ranges between 6 and 15). The color key is depicted on the right side of the figure. The NYVAC-C-KC-ΔB19R mutant induced the expression of IFN genes in cDCs and pDCs, as well as genes involved with antigen processing and presentation genes.
Figure 5
Figure 5. Maturation of cDCs after infection with recombinant NYVAC.
Expression of CD86 on infected cDCs and moDCs is shown. DCs were infected for one hour with the different recombinant vectors and their phenotype was analyzed by flow cytometry after 48 hours of culture. The shaded graphs represent NYVAC-wt infected DCs; solid lines represent the indicated recombinant NYVAC. Mean fluorescence intensity (MFI) is indicated in the plots. MoDC and cDC infected with NYVAC-C-ΔB19R showed enhanced CD86 expression in contrast to DCs infected with the parental NYVAC-C or NYVAC-C-KC. Infection with NYVAC-C-KC-ΔB19R did not induce increased CD86 expression. Data are representative of at least two independent experiments.
Figure 6
Figure 6. Gag expression in human moDCs and HeLa cells.
Histograms show α-Gag KC57 staining in infected moDCs and HeLa cells. Cells were infected at MOI 5 for one hour. After six and 24 hours incubation, cells were harvested and stained for Gag expression by ICS as described in the Materials and Methods. Percentage of Gag-expressing cells and median fluorescence intensity were determined and indicated in the graphs. Shaded graphs represent staining of NYVAC-wt infected cells. Solid line represents cells infected with the different variants. Gag expression after infection with NYVAC-C-KC is higher compared to NYVAC-C, both in moDC and HeLa cells, at multiple time points after infection, correlating with the increased replication capacity of NYVAC-C-KC. Data are representative of at least three similar independent experiments.
Figure 7
Figure 7. Antigen cross-presentation to HIV- and vaccinia-specific CD8 T-cell clones.
MoDCs were incubated with infected apoptotic HeLa cells before CD8 T-cell clones were added. After overnight incubation, cells were harvested and analyzed. A) Cytokine production by HIV-specific CD8 T cells on a representative sample. Among the lymphocyte population, CD8 T cells were gated and analyzed for IFN-γ, TNF-α, IL-2 and MIP-1β production. Cytokine production by HIV-specific CD8 T cells (B) or vaccinia-specific CD8 T cells (C) was determined. Virus variants are indicated on the x-axis; percentages CD8 T cells producing any cytokine are indicated on the y-axis. P-values between NYVAC-C and the mutants are indicated. Mean and standard deviation of four to six repetitions are shown. NYVAC-C elicited only very low numbers of cytokine-producing HIV- or vaccinia-specific CD8 T cells, only detected with the higher virus inoculum. Deletion of B19R from the parental NYVAC virus strain did not improve cytokine production. In contrast, moDCs cross presenting NYVAC-C-KC induced enhanced cytokine production by HIV- and vaccinia-specific CD8 T cells compared to NYVAC-C; additional deletion of the B19R gene in the NYVAC-C-KC background did not further increase cytokine production.
Figure 8
Figure 8. HIV-1-specific CD8 T-cell responses of unmodified and modified NYVAC using a CFSE proliferation assay.
NYVAC vectors, either containing the HIV-1 clade C trangenes or empty, were evaluated in vitro using cryopreserved PBMCs from HIV-1-infected subjects. Cell proliferation using the CFSE dilution assay was measured 6 days after stimulation. At the end of the stimulation period, cells were stained for CD3, CD4, CD8 and a viability marker and analyzed by flow cytometry. Of note, NYVAC viruses were tested in a dose-dependent manner (ranging from 107–104 PFU, i.e. corresponding to a range of MOI going from 10-0.01). Shown is the proportion of proliferating cells (i.e. CFSElow cells) gated on live CD3+CD8+ T cells after 6 days of in vitro stimulation with the different doses of virus. Mean values, corrected for empty NYVAC background, and standard deviation of at least six experiments are shown. No proliferation of HIV-specific CD8 T cells was observed after infection with NYVAC-C and the B19R deletion mutant. In contrast, 15-20% CFSElow CD8 T cells were present after NYVAC-C-KC or NYVAC-C-KC-ΔB19R infection, indicating increased proliferation after infection.

Similar articles

Cited by

References

    1. Burton DR, Desrosiers RC, Doms RW, Koff WC, Kwong PD, et al. HIV vaccine design and the neutralizing antibody problem. Nat Immunol. 2004;5:233–236. - PubMed
    1. Richman DD, Wrin T, Little SJ, Petropoulos CJ. Rapid evolution of the neutralizing antibody response to HIV type 1 infection. Proc Natl Acad Sci U S A. 2003;100:4144–4149. - PMC - PubMed
    1. Sekaly RP. The failed HIV Merck vaccine study: a step back or a launching point for future vaccine development? J Exp Med. 2008;205:7–12. - PMC - PubMed
    1. Wei X, Decker JM, Wang S, Hui H, Kappes JC, et al. Antibody neutralization and escape by HIV-1. Nature. 2003;422:307–312. - PubMed
    1. Koup RA, Safrit JT, Cao Y, Andrews CA, McLeod G, et al. Temporal association of cellular immune responses with the initial control of viremia in primary human immunodeficiency virus type 1 syndrome. J Virol. 1994;68:4650–4655. - PMC - PubMed

Publication types

MeSH terms

Associated data