

Gene expression profiles from formalin fixed paraffin embedded breast cancer tissue are largely comparable to fresh frozen matched tissue
- PMID: 21347257
- PMCID: PMC3037966
- DOI: 10.1371/journal.pone.0017163
Gene expression profiles from formalin fixed paraffin embedded breast cancer tissue are largely comparable to fresh frozen matched tissue
Abstract
Background and methods: Formalin Fixed Paraffin Embedded (FFPE) samples represent a valuable resource for cancer research. However, the discovery and development of new cancer biomarkers often requires fresh frozen (FF) samples. Recently, the Whole Genome (WG) DASL (cDNA-mediated Annealing, Selection, extension and Ligation) assay was specifically developed to profile FFPE tissue. However, a thorough comparison of data generated from FFPE RNA and Fresh Frozen (FF) RNA using this platform is lacking. To this end we profiled, in duplicate, 20 FFPE tissues and 20 matched FF tissues and evaluated the concordance of the DASL results from FFPE and matched FF material.
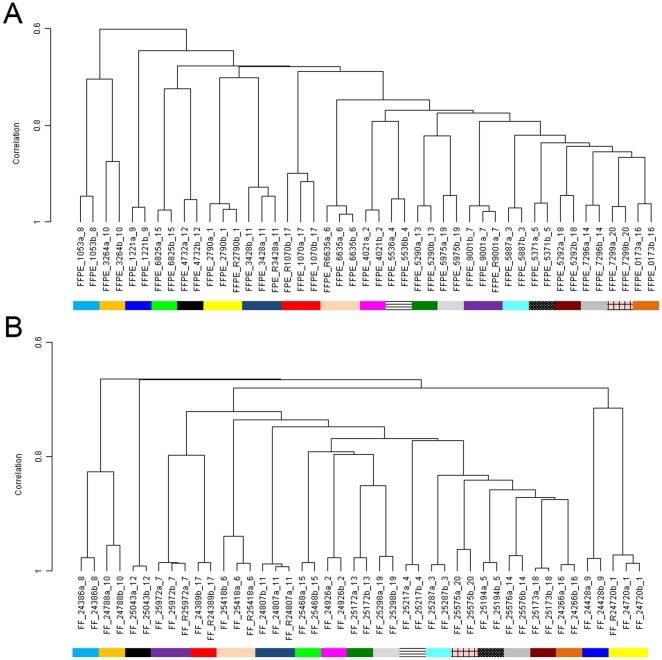
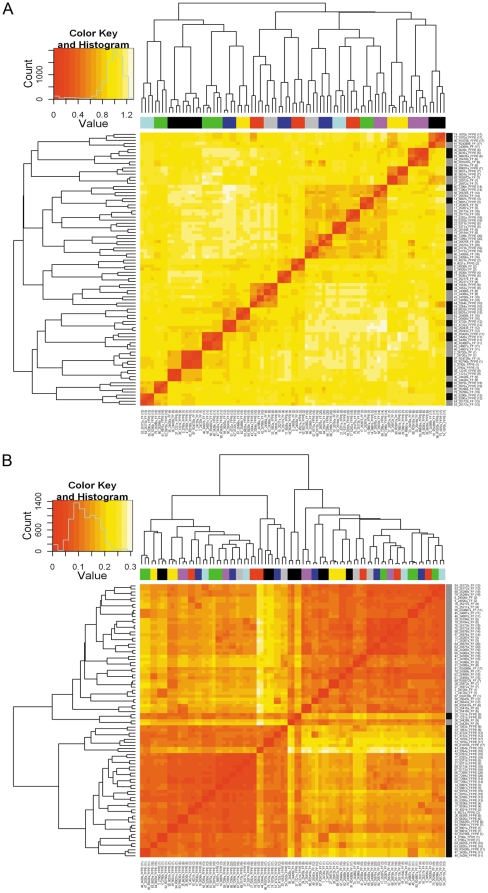
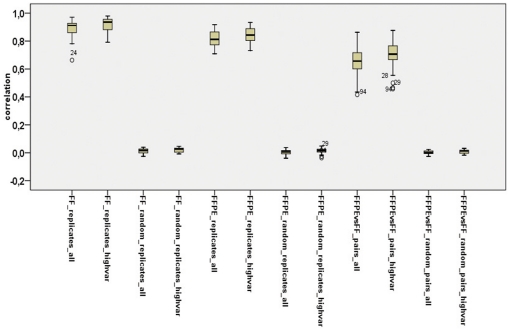
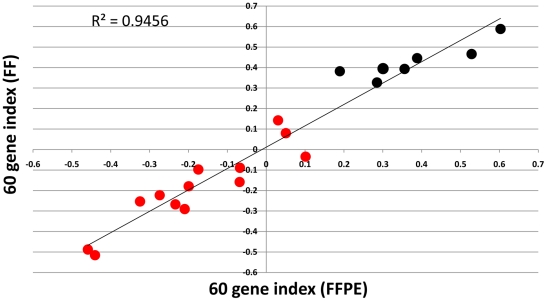
Methodology and principal findings: We show that after proper normalization, all FFPE and FF pairs exhibit a high level of similarity (Pearson correlation >0.7), significantly larger than the similarity between non-paired samples. Interestingly, the probes showing the highest correlation had a higher percentage G/C content and were enriched for cell cycle genes. Predictions of gene expression signatures developed on frozen material (Intrinsic subtype, Genomic Grade Index, 70 gene signature) showed a high level of concordance between FFPE and FF matched pairs. Interestingly, predictions based on a 60 gene DASL list (best match with the 70 gene signature) showed very high concordance with the MammaPrint® results.
Conclusions and significance: We demonstrate that data generated from FFPE material with the DASL assay, if properly processed, are comparable to data extracted from the FF counterpart. Specifically, gene expression profiles for a known set of prognostic genes for a specific disease are highly comparable between two conditions. This opens up the possibility of using both FFPE and FF material in gene expressions analyses, leading to a vast increase in the potential resources available for cancer research.
Conflict of interest statement
Figures


Similar articles
-
Reliable gene expression profiling of formalin-fixed paraffin-embedded breast cancer tissue (FFPE) using cDNA-mediated annealing, extension, selection, and ligation whole-genome (DASL WG) assay.BMC Med Genomics. 2016 Aug 20;9(1):54. doi: 10.1186/s12920-016-0215-4. BMC Med Genomics. 2016. PMID: 27542606 Free PMC article.
-
Analyses and interpretation of whole-genome gene expression from formalin-fixed paraffin-embedded tissue: an illustration with breast cancer tissues.BMC Genomics. 2010 Nov 8;11:622. doi: 10.1186/1471-2164-11-622. BMC Genomics. 2010. PMID: 21059268 Free PMC article.
-
Whole-genome gene expression profiling of formalin-fixed, paraffin-embedded tissue samples.PLoS One. 2009 Dec 3;4(12):e8162. doi: 10.1371/journal.pone.0008162. PLoS One. 2009. PMID: 19997620 Free PMC article.
-
Systematic review and feasibility study on pre-analytical factors and genomic analyses on archival formalin-fixed paraffin-embedded breast cancer tissue.Sci Rep. 2024 Aug 6;14(1):18275. doi: 10.1038/s41598-024-69285-8. Sci Rep. 2024. PMID: 39107471 Free PMC article.
-
Accuracy of Molecular Data Generated with FFPE Biospecimens: Lessons from the Literature.Cancer Res. 2015 Apr 15;75(8):1541-7. doi: 10.1158/0008-5472.CAN-14-2378. Epub 2015 Apr 2. Cancer Res. 2015. PMID: 25836717 Free PMC article. Review.
Cited by
-
Overlap Chronic Placental Inflammation Is Associated with a Unique Gene Expression Pattern.PLoS One. 2015 Jul 24;10(7):e0133738. doi: 10.1371/journal.pone.0133738. eCollection 2015. PLoS One. 2015. PMID: 26207633 Free PMC article.
-
Gene signatures in breast cancer: current and future uses.Transl Oncol. 2012 Dec;5(6):398-403. doi: 10.1593/tlo.12244. Epub 2012 Dec 1. Transl Oncol. 2012. PMID: 23323153 Free PMC article.
-
Increased expression of long non-coding RNA XIST predicts favorable prognosis of cervical squamous cell carcinoma subsequent to definitive chemoradiation therapy.Oncol Lett. 2016 Nov;12(5):3066-3074. doi: 10.3892/ol.2016.5054. Epub 2016 Aug 26. Oncol Lett. 2016. PMID: 27899965 Free PMC article.
-
Intrinsic BET inhibitor resistance in SPOP-mutated prostate cancer is mediated by BET protein stabilization and AKT-mTORC1 activation.Nat Med. 2017 Sep;23(9):1055-1062. doi: 10.1038/nm.4379. Epub 2017 Aug 14. Nat Med. 2017. PMID: 28805822 Free PMC article.
-
TruSeq-Based Gene Expression Analysis of Formalin-Fixed Paraffin-Embedded (FFPE) Cutaneous T-Cell Lymphoma Samples: Subgroup Analysis Results and Elucidation of Biases from FFPE Sample Processing on the TruSeq Platform.Front Med (Lausanne). 2017 Sep 22;4:153. doi: 10.3389/fmed.2017.00153. eCollection 2017. Front Med (Lausanne). 2017. PMID: 29018799 Free PMC article.
References
Publication types
MeSH terms
Substances
LinkOut - more resources
Full Text Sources
Other Literature Sources
Medical
Molecular Biology Databases
Miscellaneous
