

New functions of Ctf18-RFC in preserving genome stability outside its role in sister chromatid cohesion
- PMID: 21347277
- PMCID: PMC3037408
- DOI: 10.1371/journal.pgen.1001298
New functions of Ctf18-RFC in preserving genome stability outside its role in sister chromatid cohesion
Abstract
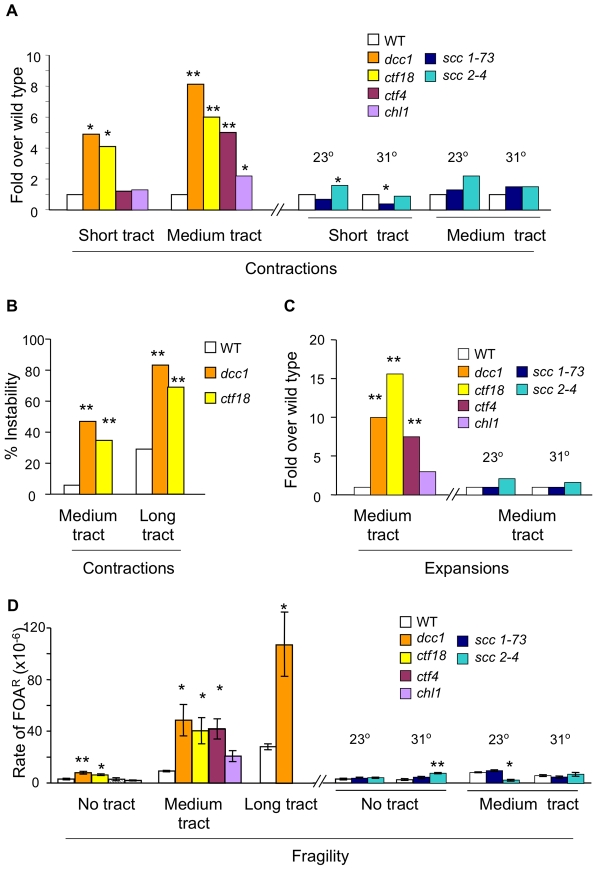
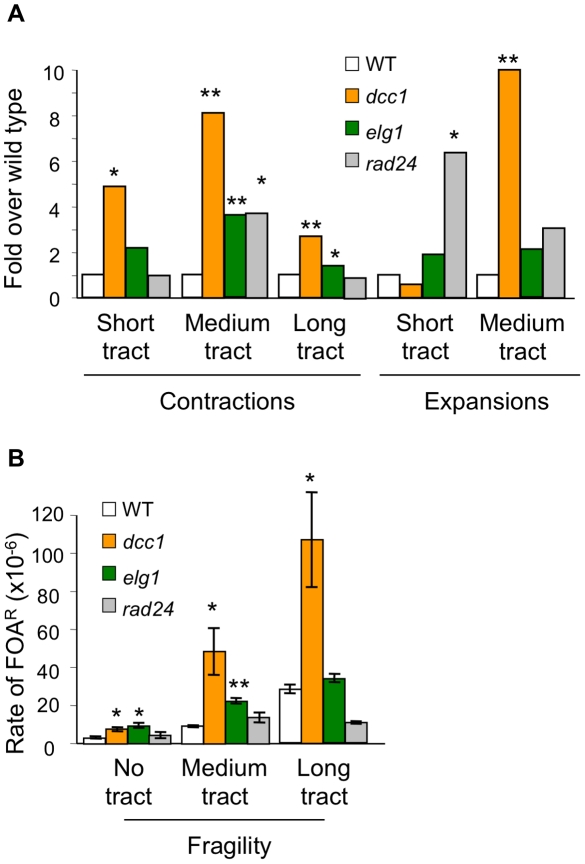
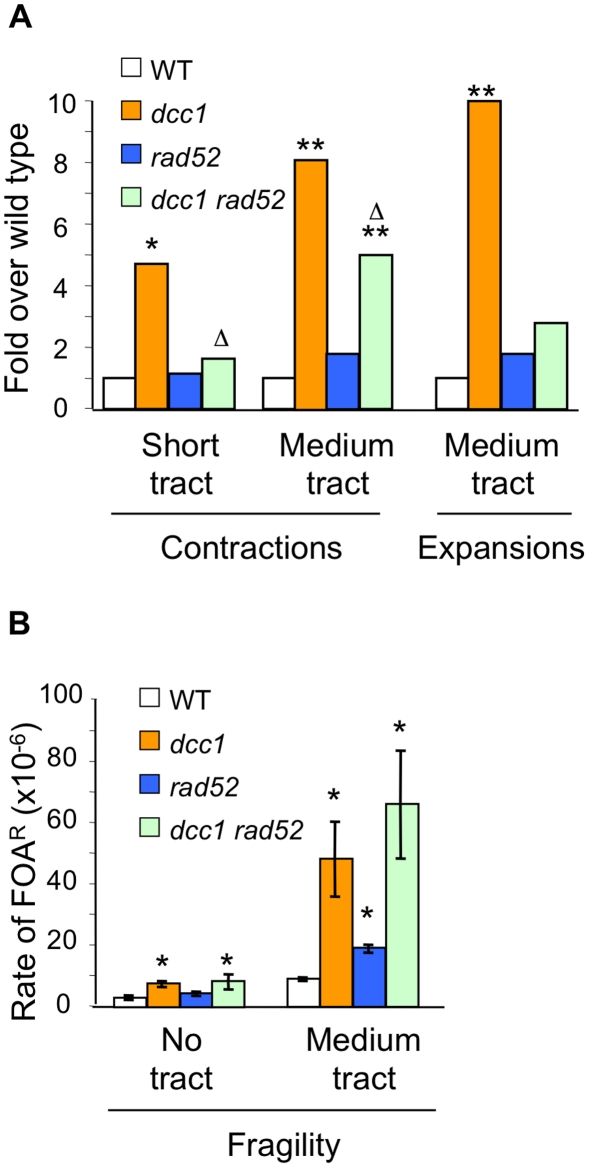
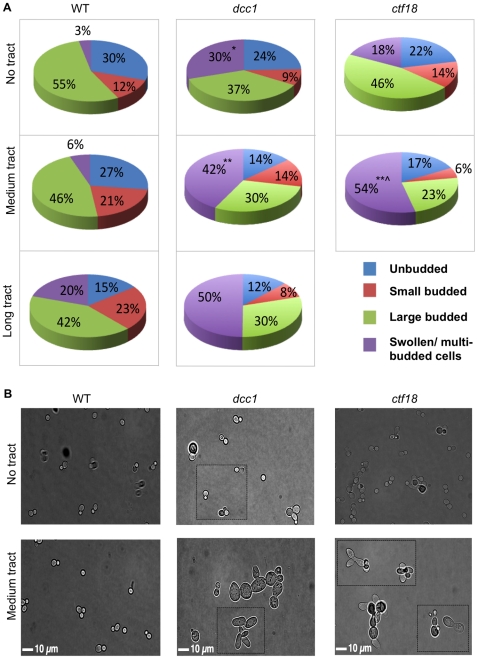
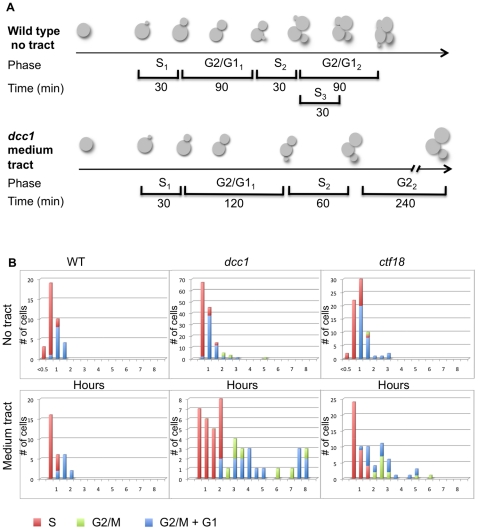
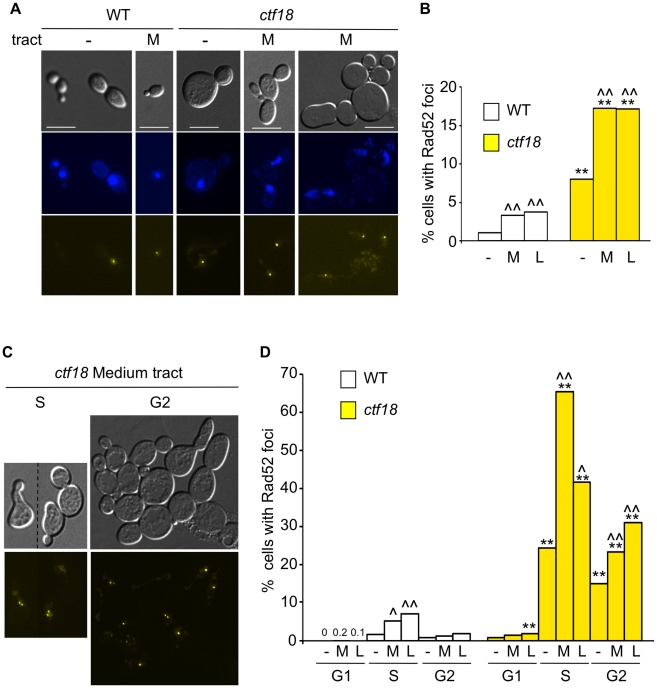
Expansion of DNA trinucleotide repeats causes at least 15 hereditary neurological diseases, and these repeats also undergo contraction and fragility. Current models to explain this genetic instability invoke erroneous DNA repair or aberrant replication. Here we show that CAG/CTG tracts are stabilized in Saccharomyces cerevisiae by the alternative clamp loader/unloader Ctf18-Dcc1-Ctf8-RFC complex (Ctf18-RFC). Mutants in Ctf18-RFC increased all three forms of triplet repeat instability--expansions, contractions, and fragility--with effect over a wide range of allele lengths from 20-155 repeats. Ctf18-RFC predominated among the three alternative clamp loaders, with mutants in Elg1-RFC or Rad24-RFC having less effect on trinucleotide repeats. Surprisingly, chl1, scc1-73, or scc2-4 mutants defective in sister chromatid cohesion (SCC) did not increase instability, suggesting that Ctf18-RFC protects triplet repeats independently of SCC. Instead, three results suggest novel roles for Ctf18-RFC in facilitating genomic stability. First, genetic instability in mutants of Ctf18-RFC was exacerbated by simultaneous deletion of the fork stabilizer Mrc1, but suppressed by deletion of the repair protein Rad52. Second, single-cell analysis showed that mutants in Ctf18-RFC had a slowed S phase and a striking G2/M accumulation, often with an abnormal multi-budded morphology. Third, ctf18 cells exhibit increased Rad52 foci in S phase, often persisting into G2, indicative of high levels of DNA damage. The presence of a repeat tract greatly magnified the ctf18 phenotypes. Together these results indicate that Ctf18-RFC has additional important functions in preserving genome stability, besides its role in SCC, which we propose include lesion bypass by replication forks and post-replication repair.
Conflict of interest statement
The authors have declared that no competing interests exist.
Figures
Similar articles
-
The Elg1-RFC clamp-loading complex performs a role in sister chromatid cohesion.PLoS One. 2009;4(3):e4707. doi: 10.1371/journal.pone.0004707. Epub 2009 Mar 5. PLoS One. 2009. PMID: 19262753 Free PMC article.
-
The ELG1 clamp loader plays a role in sister chromatid cohesion.PLoS One. 2009;4(5):e5497. doi: 10.1371/journal.pone.0005497. Epub 2009 May 11. PLoS One. 2009. PMID: 19430531 Free PMC article.
-
Replication protein A-directed unloading of PCNA by the Ctf18 cohesion establishment complex.Mol Cell Biol. 2005 Jul;25(13):5445-55. doi: 10.1128/MCB.25.13.5445-5455.2005. Mol Cell Biol. 2005. PMID: 15964801 Free PMC article.
-
The Elg1 replication factor C-like complex: a novel guardian of genome stability.DNA Repair (Amst). 2005 Apr 4;4(4):409-17. doi: 10.1016/j.dnarep.2004.08.003. DNA Repair (Amst). 2005. PMID: 15725622 Review.
-
Functions of Multiple Clamp and Clamp-Loader Complexes in Eukaryotic DNA Replication.Adv Exp Med Biol. 2017;1042:135-162. doi: 10.1007/978-981-10-6955-0_7. Adv Exp Med Biol. 2017. PMID: 29357057 Review.
Cited by
-
Transcription Factor E2F4 Promote Proliferation, Migration, and Invasion of Gastric Cancer Cells by transcriptionally activating DSCC1.Int J Biol Sci. 2024 Sep 16;20(12):4978-4998. doi: 10.7150/ijbs.99590. eCollection 2024. Int J Biol Sci. 2024. PMID: 39309429 Free PMC article.
-
The RNA export and RNA decay complexes THO and TRAMP prevent transcription-replication conflicts, DNA breaks, and CAG repeat contractions.PLoS Biol. 2022 Dec 27;20(12):e3001940. doi: 10.1371/journal.pbio.3001940. eCollection 2022 Dec. PLoS Biol. 2022. PMID: 36574440 Free PMC article.
-
The Chromatin Remodeler Isw1 Prevents CAG Repeat Expansions During Transcription in Saccharomyces cerevisiae.Genetics. 2018 Mar;208(3):963-976. doi: 10.1534/genetics.117.300529. Epub 2018 Jan 5. Genetics. 2018. PMID: 29305386 Free PMC article.
-
Enigmatic roles of Mcm10 in DNA replication.Trends Biochem Sci. 2013 Apr;38(4):184-94. doi: 10.1016/j.tibs.2012.12.003. Epub 2013 Jan 17. Trends Biochem Sci. 2013. PMID: 23332289 Free PMC article. Review.
-
Control of Genome Integrity by RFC Complexes; Conductors of PCNA Loading onto and Unloading from Chromatin during DNA Replication.Genes (Basel). 2017 Jan 26;8(2):52. doi: 10.3390/genes8020052. Genes (Basel). 2017. PMID: 28134787 Free PMC article. Review.
References
-
- Pearson CE, Edamura KN, Cleary JD. Repeat instability: mechanisms of dynamic mutations. Nat Rev Genet. 2005;6:729–742. - PubMed
-
- Mirkin SM. Expandable DNA repeats and human disease. Nature. 2007;447:932–940. - PubMed
-
- Freudenreich CH. Chromosome Fragility: Molecular mechanisms and cellular consequences. Frontiers in Bioscience. 2007;12:4911–4924. - PubMed
-
- Kovtun IV, McMurray CT. Features of trinucleotide repeat instability in vivo. Cell Res. 2008;18:198–213. - PubMed
-
- Lin Y, Dion V, Wilson JH. Transcription promotes contraction of CAG repeat tracts in human cells. Nat Struct Mol Biol. 2006;13:179–180. - PubMed
Publication types
MeSH terms
Substances
Grants and funding
LinkOut - more resources
Full Text Sources
Molecular Biology Databases
Research Materials
Miscellaneous
