Mitigation strategies for pandemic influenza A: balancing conflicting policy objectives
- PMID: 21347316
- PMCID: PMC3037387
- DOI: 10.1371/journal.pcbi.1001076
Mitigation strategies for pandemic influenza A: balancing conflicting policy objectives
Abstract
Mitigation of a severe influenza pandemic can be achieved using a range of interventions to reduce transmission. Interventions can reduce the impact of an outbreak and buy time until vaccines are developed, but they may have high social and economic costs. The non-linear effect on the epidemic dynamics means that suitable strategies crucially depend on the precise aim of the intervention. National pandemic influenza plans rarely contain clear statements of policy objectives or prioritization of potentially conflicting aims, such as minimizing mortality (depending on the severity of a pandemic) or peak prevalence or limiting the socio-economic burden of contact-reducing interventions. We use epidemiological models of influenza A to investigate how contact-reducing interventions and availability of antiviral drugs or pre-pandemic vaccines contribute to achieving particular policy objectives. Our analyses show that the ideal strategy depends on the aim of an intervention and that the achievement of one policy objective may preclude success with others, e.g., constraining peak demand for public health resources may lengthen the duration of the epidemic and hence its economic and social impact. Constraining total case numbers can be achieved by a range of strategies, whereas strategies which additionally constrain peak demand for services require a more sophisticated intervention. If, for example, there are multiple objectives which must be achieved prior to the availability of a pandemic vaccine (i.e., a time-limited intervention), our analysis shows that interventions should be implemented several weeks into the epidemic, not at the very start. This observation is shown to be robust across a range of constraints and for uncertainty in estimates of both R(0) and the timing of vaccine availability. These analyses highlight the need for more precise statements of policy objectives and their assumed consequences when planning and implementing strategies to mitigate the impact of an influenza pandemic.
Conflict of interest statement
Roy M. Anderson is a non-executive member of the board of GlaxoSmithKline (GSK).
Figures


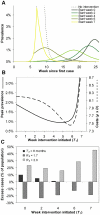
 = 32%, 34%, 36%, 37% and 49%. B Peak prevalence (solid curve) and costs of interventions calculated as
  (dashed curve), in relation to the time of commencement of intervention. C Excess number of cases for the five strategies if the parameters of the epidemic are different to those for which these interventions were designed: the availability of a strain specific vaccine is delayed until 8 months (black), transmission has been overestimated and R
0 = 1.7 (dark grey), or transmission has been underestimated and R
0 = 2 (light grey).
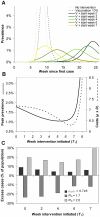
 = 28%, 30%, 31%, 32% and 33%. B Peak prevalence (solid curve) and costs of interventions calculated as
  (dashed curve), in relation to the time of commencement of intervention. C Excess number of cases for the five strategies if the parameters of the epidemic are different to those for which these interventions were designed: the pre-pandemic vaccine is less effective (black), transmission has been overestimated and R
0 = 1.7 (dark grey), or transmission has been underestimated and R
0 = 2 (light grey).
(dashed curve), in relation to the time of commencement of intervention. C Excess number of cases for the five strategies if the parameters of the epidemic are different to those for which these interventions were designed: the pre-pandemic vaccine is less effective (black), transmission has been overestimated and R
0 = 1.7 (dark grey), or transmission has been underestimated and R
0 = 2 (light grey).References
-
- World Health Organisation. Pandemic (H1N1) 2009. 2009. Available: http://www.who.int/csr/disease/swineflu/en/. Accessed 18 December 2010.

